Enjoying this bot account
https://t.co/uRTj3LWgDm
— Data Science Renee (@BecomingDataSci) April 24, 2018
Today, I saw this tweet:
you could replicate this by gluing various dried out legumes to poster board if you wanted to https://t.co/icHeUuy4Ob
— Rebecca Williams (@internetrebecca) May 5, 2018
and imagined a census tract visualization made out of dried noodles and beans. Being as spontaneous as usual, I asked if anyone would be interested in having a #CraftyDataViz contest, and several people responded yes! So, here we are. Time to get creative!
Basic Contest Rules:
Find a data visualization online, in a book, or create one yourself. We need a digital version of the viz you’re recreating, so save the link or take a photo of it. Now, gather up some goodies from around the house or yard and/or hit the craft store (or maybe the grocery store!) and recreate that data viz in craft form!
It does need to be a physical end-product – no completely digital entries (though usage of printed elements is ok), but other than that there are no restrictions on materials or approach – get as creative as you want! At least part of it needs to be handmade or manually assembled (so no completely 3D-printed entries, for instance, but parts could be 3D printed) You can replicate the viz in detail, or do an abstract interpretation of it :)
I will find some judges that know something about data visualization, and they will pick winners in each of the following categories (we might do some sort of online vote to narrow down the entries, depending on how many there are):
- Most Beautiful/Visually Impressive – as long as the judges can tell it’s related to the original data viz in some way, it qualifies, and the judges will pick the overall most gorgeous or awe-inspiring outcome to win this category
- Most Informational – to win this category, your visualization needs to be especially readable/interpretable. Judges will pick the one that most effectively communicates the point of the original data viz
- Most Fun! – the definition of this is up to the judges, but if it makes the judges laugh, it probably has a good chance at winning
The winner of each category will be featured here and on my @becomingdatasci twitter account, and win their choice of item from the Becoming a Data Scientist store! By then, I’ll have the 2018 Summer of Data Science items up, since the end of this contest will also mark the launch of #SoDS18!
How to Enter:
Post a tweet (or a comment below if you don’t use twitter) that includes a link or image of the original dataviz, as well as a photo or video of your creation! On twitter, use hashtag #CraftyDataViz so I can find your entry!
The entry period starts today and ends on 11:59PM EDT on Sunday, May 27. I’ll plan to post the entries for viewing/judging on Monday, May 28 (Memorial Day in the United States).
HAVE FUN!! I’m excited to see what you create!!
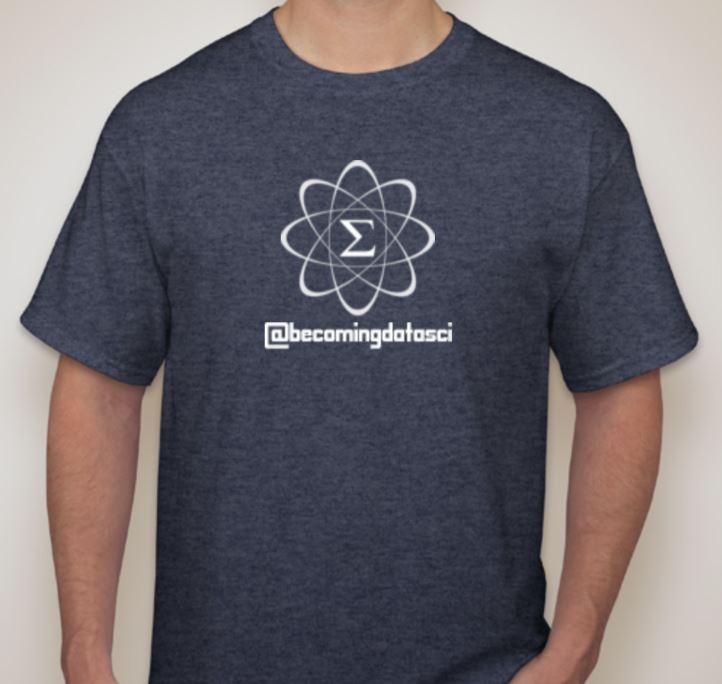
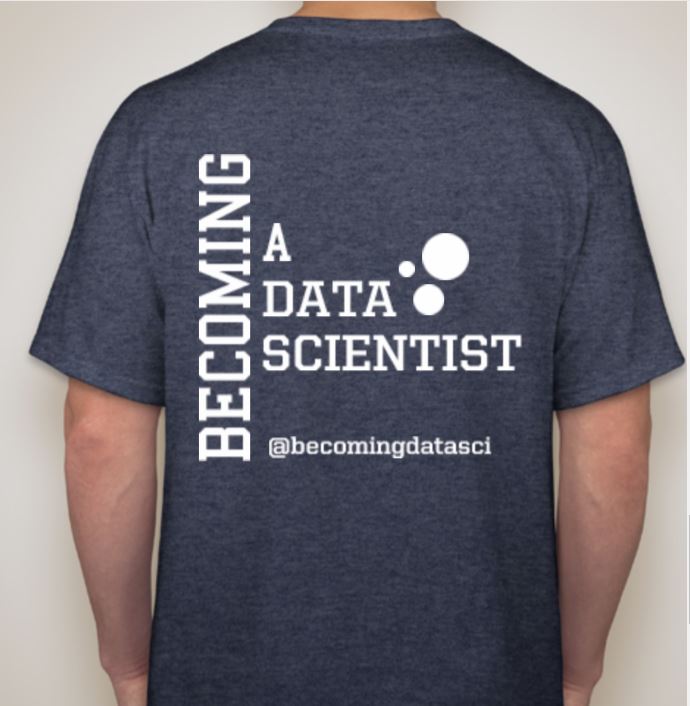
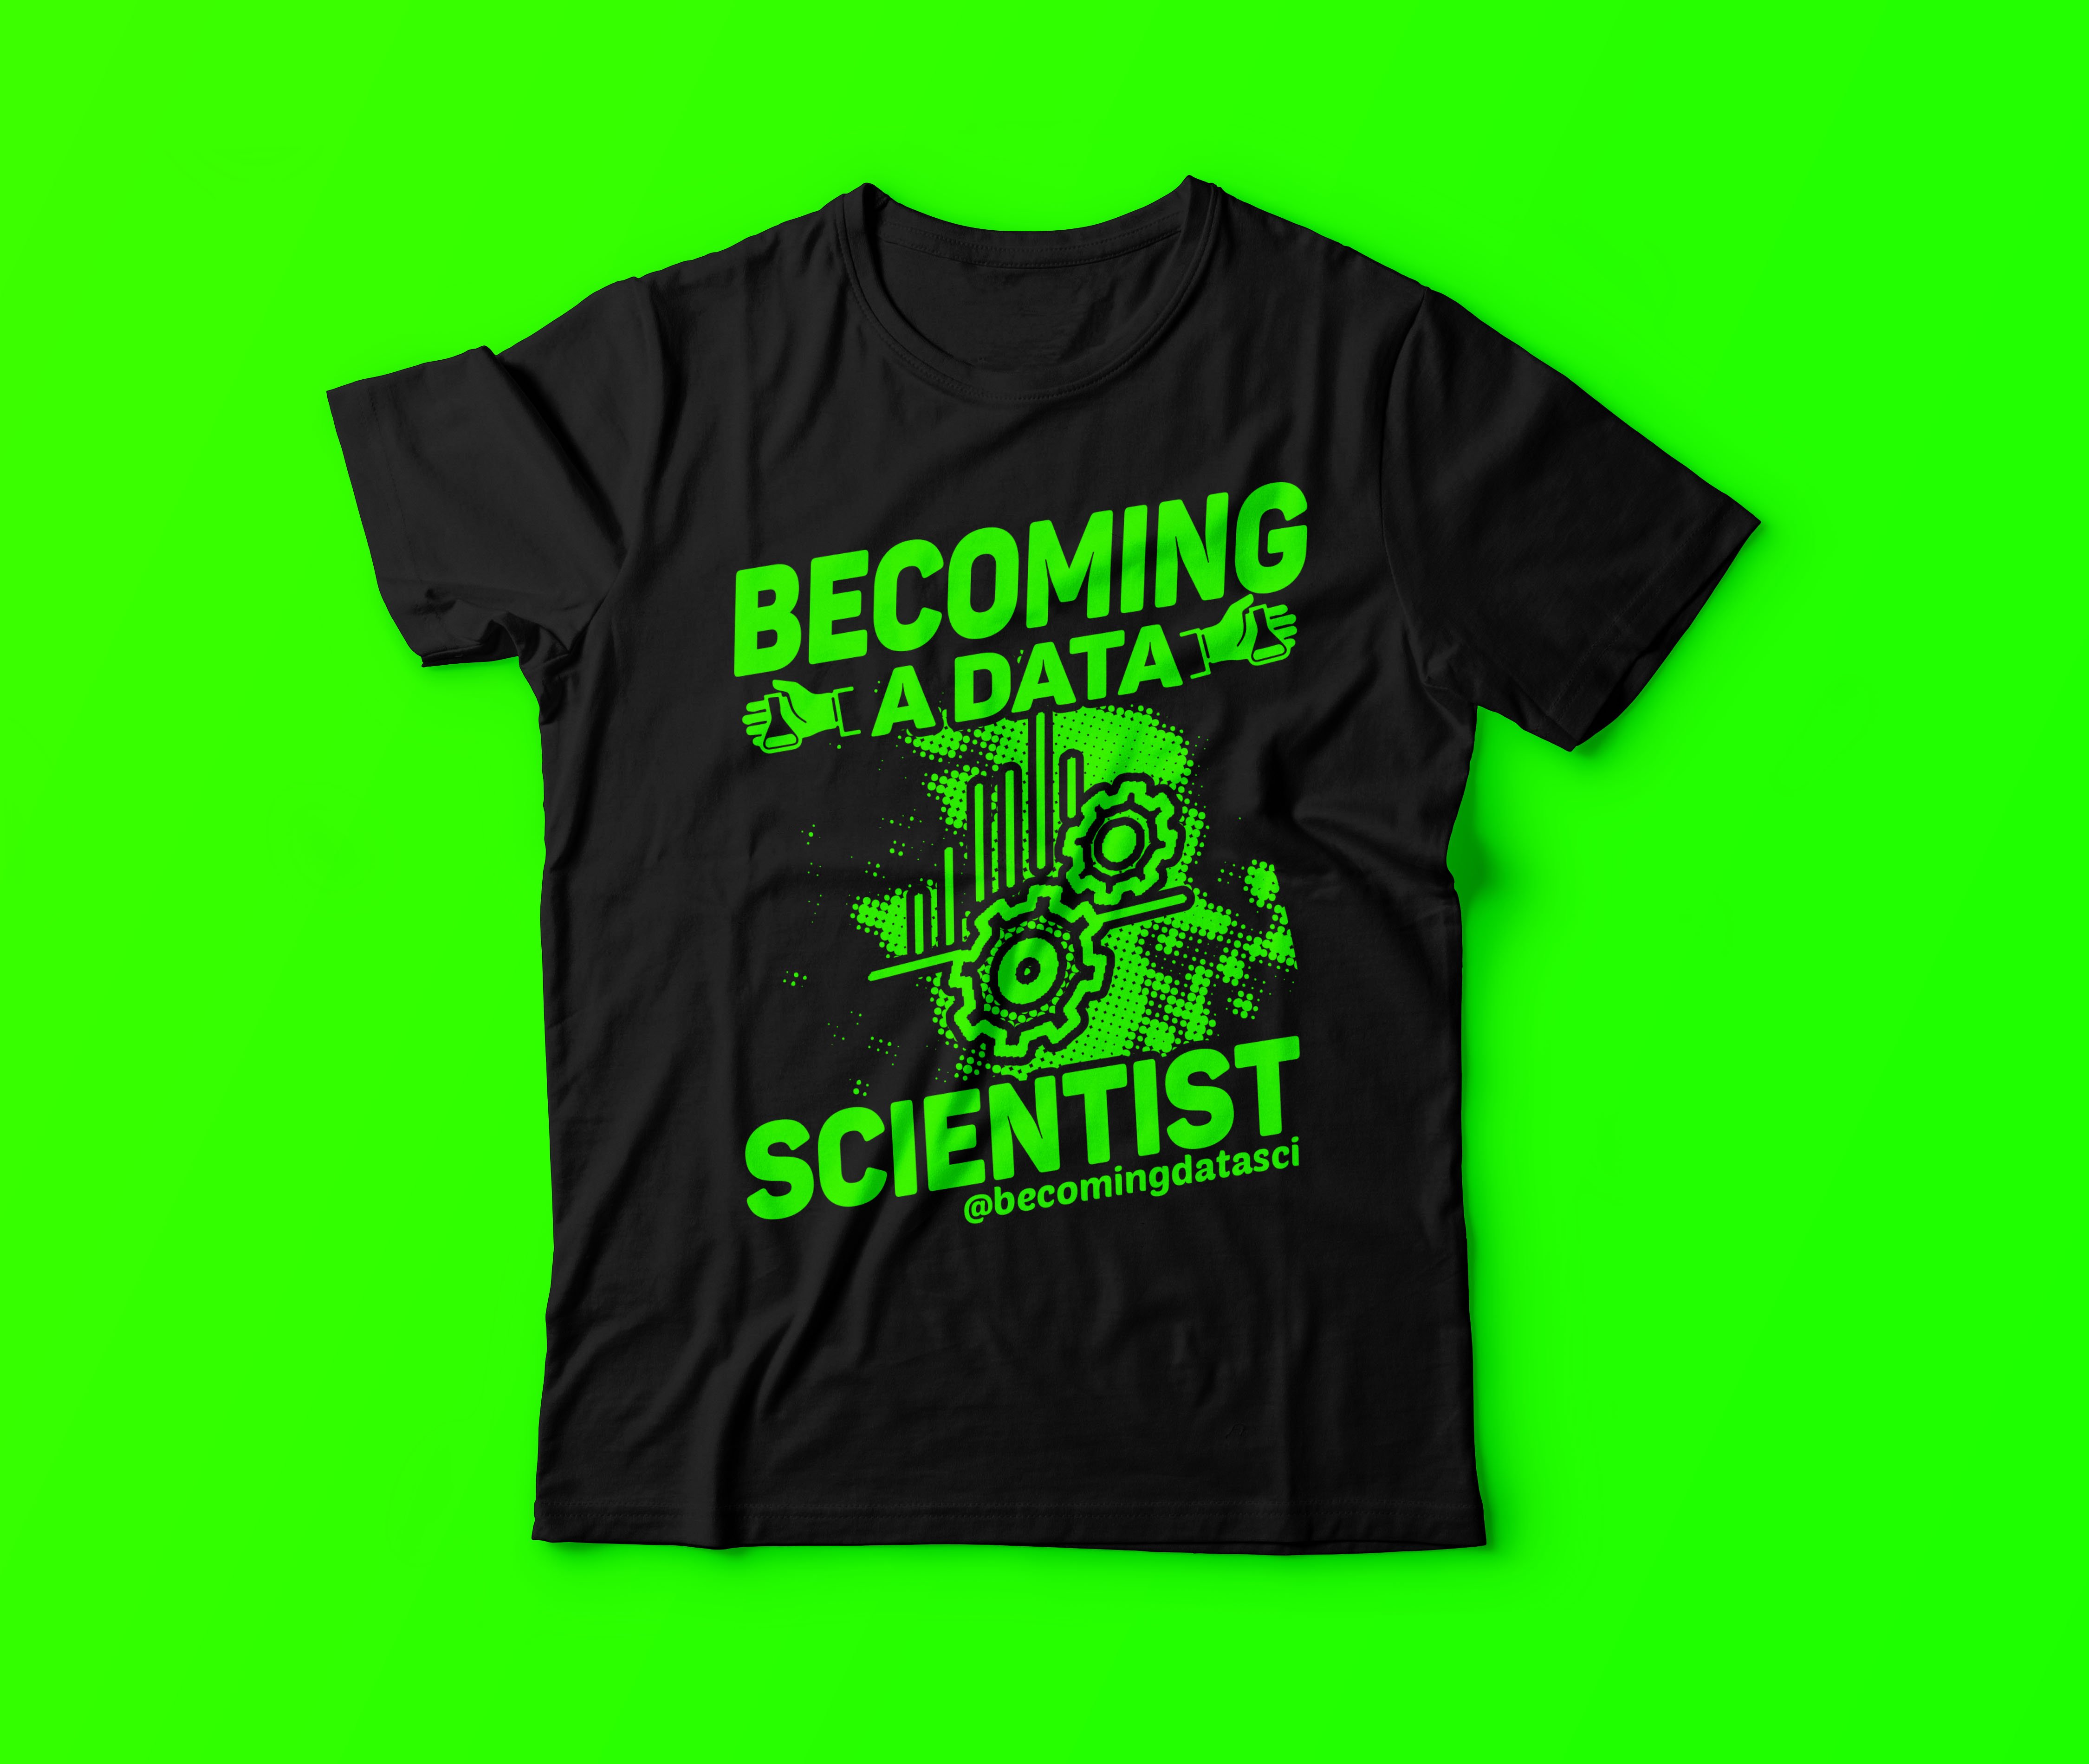
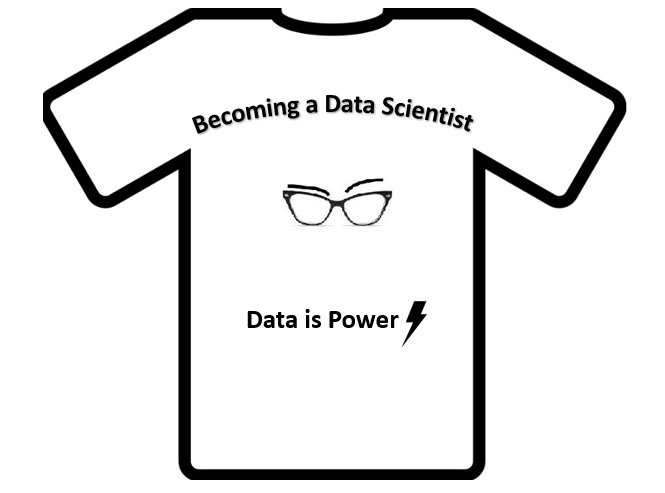
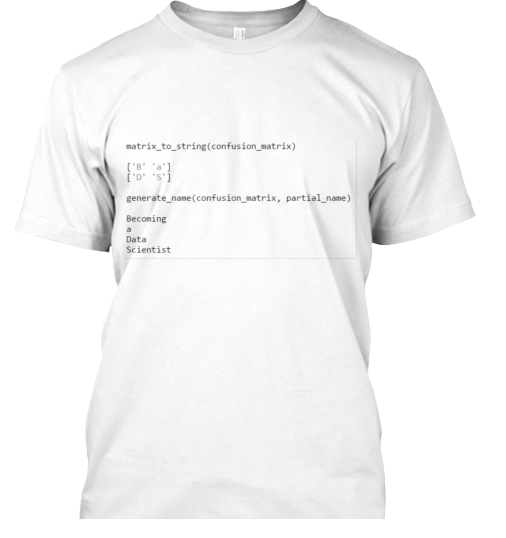
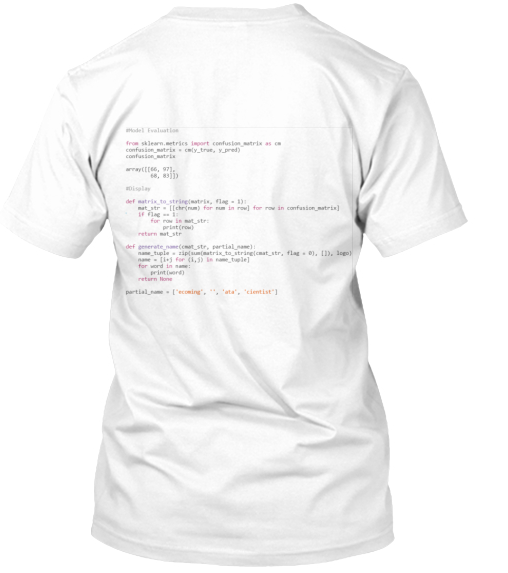
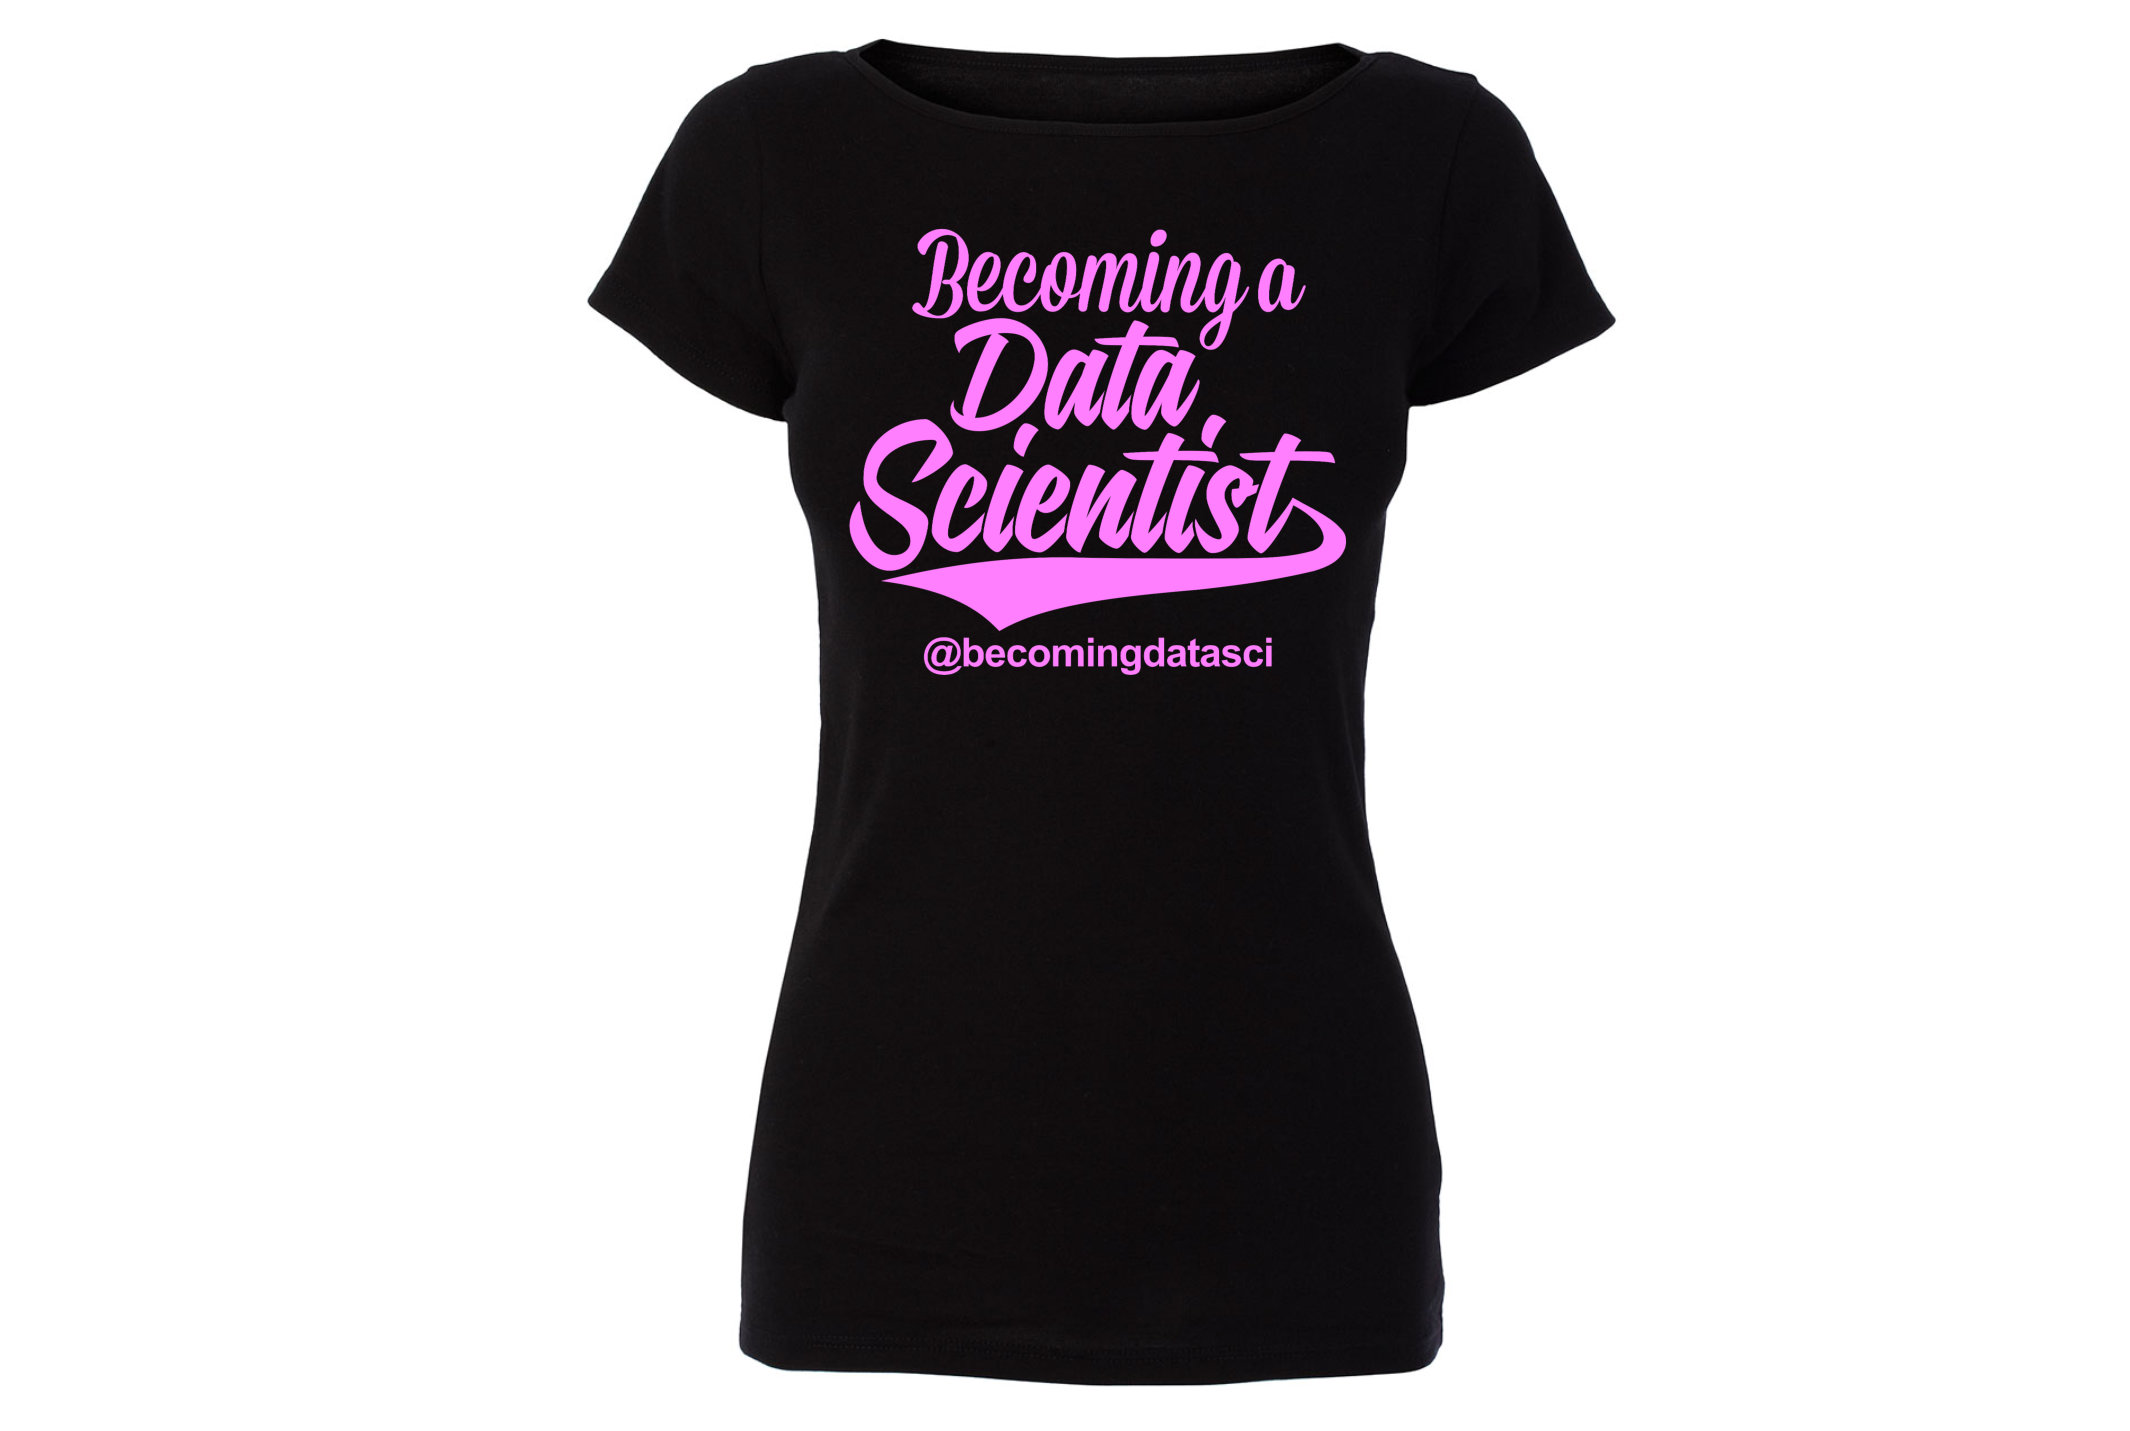
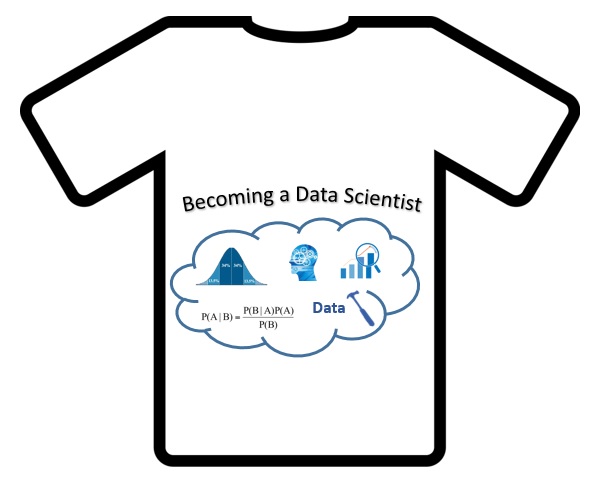
]]>For the ones that aren’t t-shirt-print-ready, I’ll get a graphic designer to tidy them up, so don’t worry about whether they’re printable when you vote. We can also vary colors and things like that later. Just pick the design you like!
click the images for larger views
dsnmizan
Venkat
Gordon
Kumar
Nigel

Ridhima
Ryne
Amarendra