The first activity involved setting up a development environment. Some people are using R, some using python, and there are several different development tools represented. In this thread, several people posted what setup they were using. I posted a “hello world” program and the code to output the package versions.
Activities 1-3 built upon one another to explore a dataset and generate descriptive statistics and visuals, culminating with a business Q&A:
- Activity 1 – Find & Explore a Dataset
- Activity 2 – Visuals for Exploratory Data Analysis
- Activity 3 – Business Questions & Data Answers
I analyzed a subset of data from the eBird bird observation dataset from Cornell Ornithology for these activities. Some highlights included:
– Learning how to use the pandas python package to explore a dataset (code)
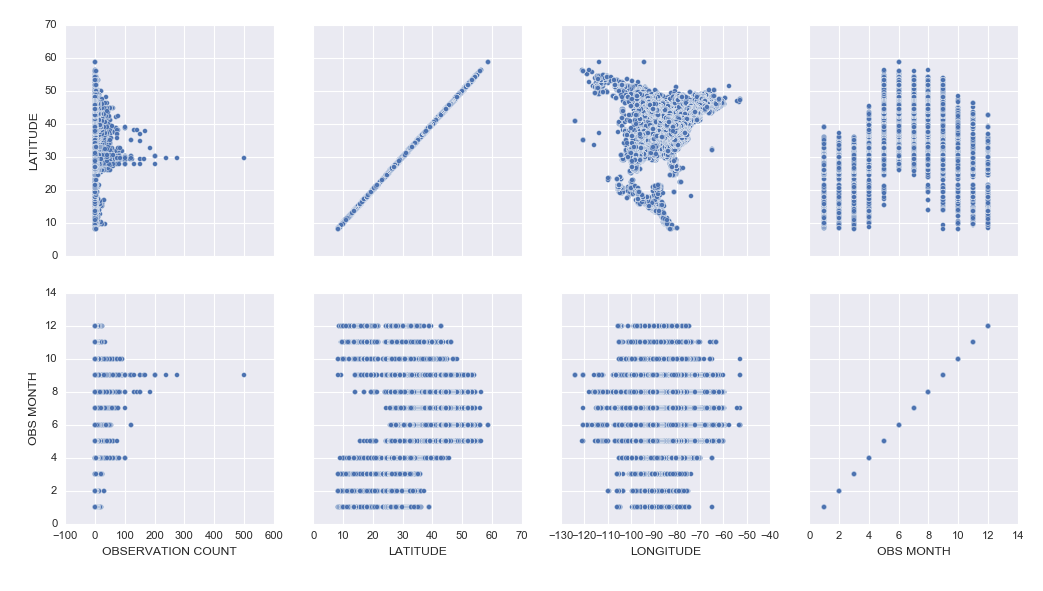
– Learning how to create cool exploratory visuals in Seaborn and Tableau. Here is an example scatterplot matrix made in Seaborn:
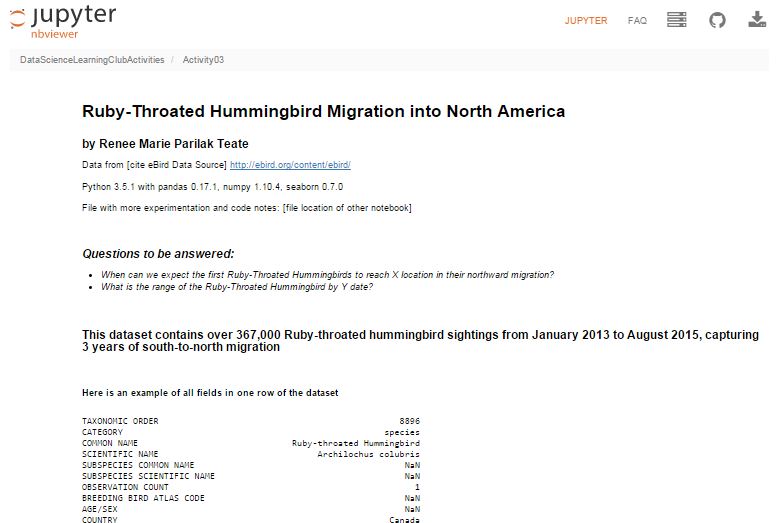
– I was most excited to learn how to build interactive Jupyter Notebook inputs, which I used to control Bokeh data visualizations to display Ruby-Throated Hummingbird migration into North America (notebook). Unfortunately, until I host them on a server where you can run the “live” version, you won’t be able to see the interactive widgets (a slider and dynamic dropdowns), but you can see a video of the slider working here:
Here’s my final output for Activity 3, a Jupyter Notebook (with code hidden, and unfortunately interactive widgets disabled) with the Q&A about the hummingbird migration:
Ruby-Throated Hummingbird Migration into North America
Activity 4 was built as a catch-up week for those of us who were behind, but had some ideas of math concepts to learn for those who had time.
We’re currently working on Activity 5, our first machine learning activity where we’re implementing Naive Bayes Classification.
All of my work is available in this github repository: https://github.com/paix120/DataScienceLearningClubActivities
I strongly encourage you to click through the forums and look at some of the other data explorations the members have been doing, including analysis of NFL data, personal music listening habits, transportation in London, German Soccer League data, top-grossing movies, and more!
It’s never too late to join the Data Science Learning Club! If you aren’t sure where to start, check out the welcome message for some clarification.
I’ll post again when I complete some of the machine learning activities!
]]>