Note: images in this notebook are "hard-coded" because the google charts won't render from this html file. In the real notebook on Google Datalab, they are interactive!
Connect to database
(BigQuery Natality table I set up)
SELECT year, month, day, wday, state, is_male, gestation_weeks, mother_age, father_age, apgar_1min, apgar_5min, weight_pounds FROM [publicdata:samples.natality] where year between 1980 and 1984
In [1]:
%%sql
#count how many records are in my table
select count(*)
from [thematic-lore-110201:Natality_1980_1984.Births_1980_1984]
Out[1]:

(rows: 1, time: 0.7s, 0B processed, job: job_uNrRTvKtTrnTY9hoY_VOuYK-yAU)
In [2]:
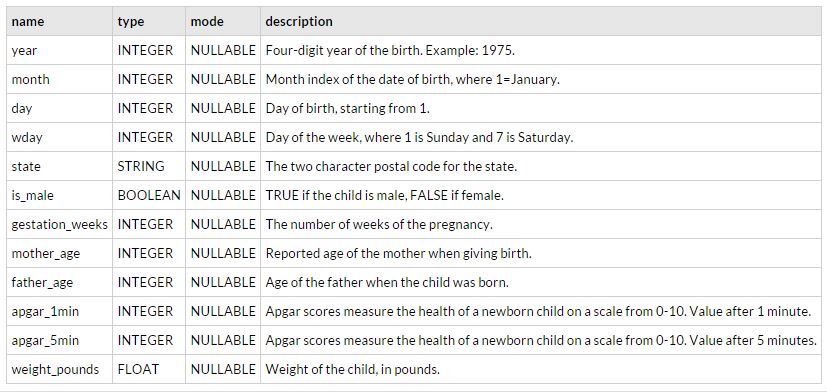
#check out the schema of the table
%bigquery schema --table thematic-lore-110201:Natality_1980_1984.Births_1980_1984
Out[2]:
bigquery command to make this sql into a module
SQL to count births by year and month
In [3]:
%%sql --module birthdata
select year, month, concat(string(month),"/",string(year)) as yearmonth, count(*) as births
from [thematic-lore-110201:Natality_1980_1984.Births_1980_1984]
group by year, month, yearmonth
order by year, month
chart births by month and year - line chart
In [4]:
%chart line --data birthdata --fields yearmonth,births
Out[4]:
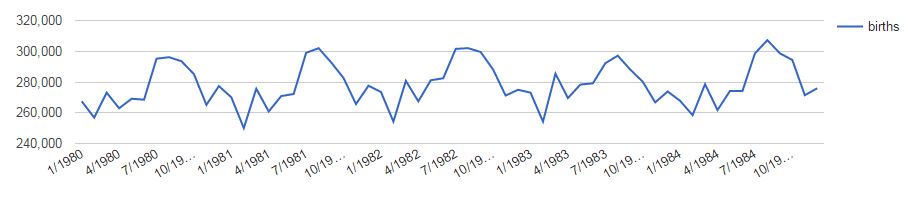
The birth rates are cyclical! Which month has the most?
In [ ]:
%%sql --module birthmonth
select month, count(*) as births
from [thematic-lore-110201:Natality_1980_1984.Births_1980_1984]
group by month
order by month
In [ ]:
%chart columns --data birthmonth --fields month,births
width: 500
height: 500
Hmm, not sure how to adjust axis or labeling yet.
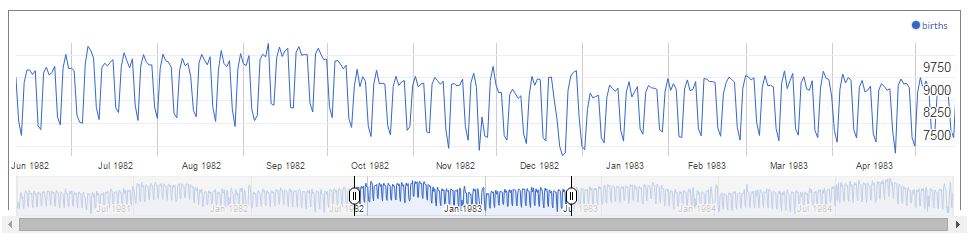
what does it look like if we show it as a time series with every day visible?
In [1]:
%%sql --module birth_by_day
SELECT year, month, day, count(*) AS births,
       TIMESTAMP(STRING(year) + '-' + STRING(month) + '-' + STRING(day)) AS timestamp
FROM [thematic-lore-110201:Natality_1980_1984.Births_1980_1984]
where year > 1980 and day < 99 --there is a day 99 that is messing up the chart
group by year, month, day, timestamp
ORDER BY year DESC, month DESC, day DESC
In [2]:
%%chart annotation --fields timestamp,births --data birth_by_day
displayZoomButtons: false
Out[2]:
is there a day of week difference?
In [3]:
%%sql
select wday, count(*) as births
from [thematic-lore-110201:Natality_1980_1984.Births_1980_1984]
group by wday
order by wday
Out[3]:
(rows: 1, time: 1.2s, 0B processed, job: job_4WOnTsB8jvj8Ny8cRL7NaPLUPW0)
Turns out there's no data in the wday column! Maybe for this range of years.
let's calculate the weekday in SQL
In [4]:
%%sql --module birthweekday
select dayofweek(TIMESTAMP(TIMESTAMP(STRING(year) + '-' + STRING(month) + '-' + STRING(day)))) as weekday, count(*) as births
from [thematic-lore-110201:Natality_1980_1984.Births_1980_1984]
where year is not null and day is not null and month is not null and day < 99
group by weekday
order by weekday
In [5]:
%chart columns --data birthweekday --fields weekday,births
width: 500
height: 500
Out[5]:
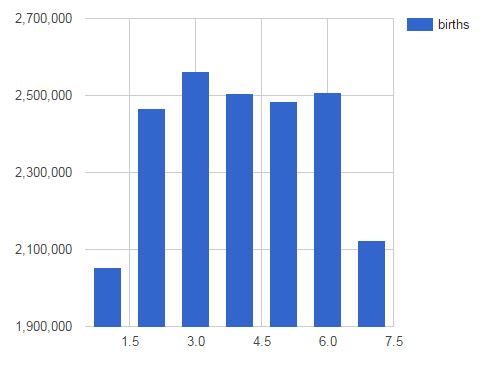
Relatively few births on weekends!
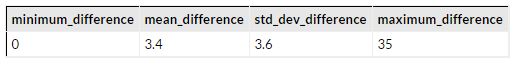
stats on difference between mother and father ages
In [6]:
%%sql
select min(abs(father_age - mother_age)) as minimum_difference, round(avg(abs(father_age - mother_age)),1) as mean_difference,
  round(stddev(abs(father_age - mother_age)),1) as std_dev_difference, max(abs(father_age - mother_age)) as maximum_difference
from [thematic-lore-110201:Natality_1980_1984.Births_1980_1984]
where year = 1982 and month = 1 and day = 20 and father_age < 99
Out[6]:
(rows: 1, time: 3.3s, 668MB processed, job: job_StgR7Z-jBucR5CUuBKYE7rIXfIc)
slightly positive trendline? still very small R^2
In [5]:
%%sql
select gestation_weeks
from [thematic-lore-110201:Natality_1980_1984.Births_1980_1984]
group by gestation_weeks --got error that select distinct not currently available
order by gestation_weeks
Out[5]:
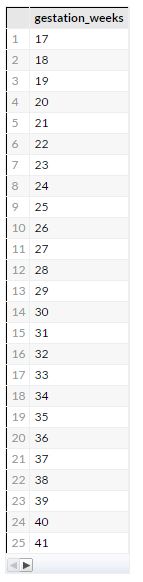
(rows: 37, time: 1.4s, 133MB processed, job: job_kMYXkAlx1qS18mrPF8O4NpVsanA)
In [7]:
%%sql --module gestation_weight
select gestation_weeks, weight_pounds
from [thematic-lore-110201:Natality_1980_1984.Births_1980_1984]
where year = 1982 and month = 1 and day = 20
and gestation_weeks < 99 and gestation_weeks is not null
--forgot to bring in live baby variable, so using apgar as proxy
and apgar_1min is not null and apgar_1min < 99
In [3]:
%%chart scatter --data gestation_weight
height: 800
hAxis:
  title: Gestation Weeks
vAxis:
  title: Birth Weight (lbs)
trendlines:
  0:
    type: linear
    color: green
    showR2: true
    visibleInLegend: true
Out[3]:
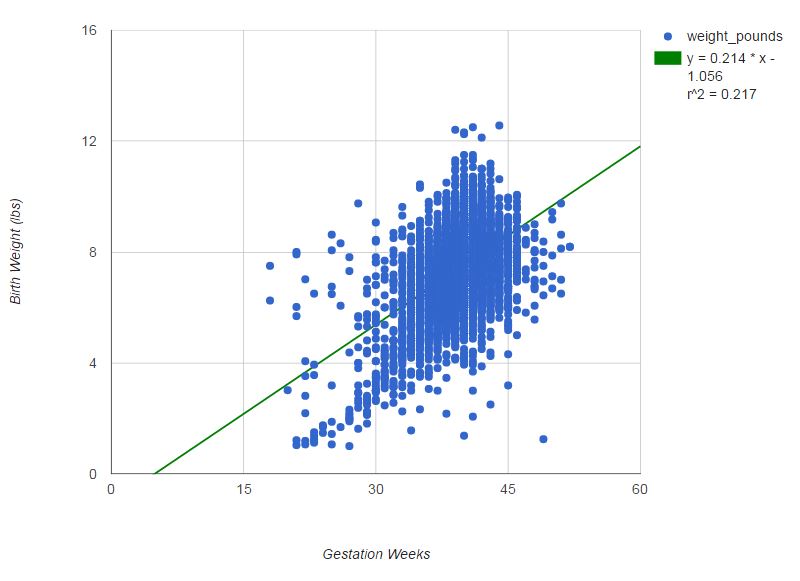
hm, still not as high of an R^2 as I would have expected! Lots of variation in the weight even at similar weeks.
In [ ]: