I was considering waiting until I’m done before posting about this project, but instead I thought I’d post my progress and plans while I think about the next steps.
I posted earlier about using the UsesThis API to retrieve data about what other software people that use X software also use. I thought I was going to have to code a workaround for people that didn’t have any software listed in their interviews, but when I tweeted about it, Daniel from @usesthis replied that it was actually a bug and fixed it immediately! It makes it even more fun to develop since he is excited about me using his API!
@BecomingDataSci: YES! It’s *awesome*.
— The Setup (@usesthis) June 19, 2015
After seeing those results, I thought it would be interesting (and educational) to learn how to do a Market Basket Analysis on the software data. Market Basket Analysis is a data mining technique where you can find out what items are usually found in combination, such as groceries people typically buy together. For instance, do people often buy cereal and milk together? If you buy taco shells and ground beef, are you likely to also buy shredded cheese? This type of analysis allows brick and mortar retailers to decide how to position items in a store. Maybe they will put items regularly purchased together closer together to make the trip more convenient. Maybe they will place coupons or advertisements for shredded cheese next to the taco shells. Or maybe they will place the items further apart so you have to pass more goods on the way from one item to the other and are more likely to pick up something you otherwise wouldn’t have. Online retailers can use this type of analysis to recommend products to increase the size of your purchase. “Other customers that added item X to their shopping cart also purchased items Y and Z.”
Because I had this interesting set of software usage from The Setup’s interviews, I wanted to analyze what products frequently go together. I searched Google for ‘Market Basket Analysis python,’ and it led me to this tweet by @clayheaton:
I just wrote a simple Market Basket analysis module for Python. #analytics https://t.co/aVf58zcHJa
— Clay Heaton (@clayheaton) April 4, 2014
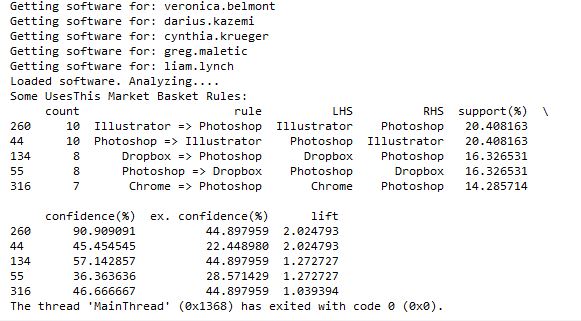
I followed that link and checked out the code on github and it seemed to make sense, so I put the results of my usesthis API request into a format it could use. I did a test with the data from 5 interviews, and it ran. Then I tried 50 interviews, and the results showed that people that use Photoshop were likely to also use Illustrator, and vice-versa. It appeared to be working!
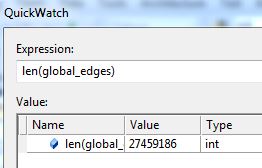
However, I then hit a snag. I tried to run it with all of the software data, and it ran for a long time then crashed when my computer ran out of memory. Since it’s building an association graph with an edge for every rule (combination of software used), with up to two pieces of software per “side” of the rule (such as “people that have Photoshop and Illustrator also have a Mac”), you can imagine the graph gets pretty big when you have over 10,000 user-software combinations.
I tweeted about this and Clay suggested modifying his code to store the items in a sparse matrix instead of a graph, and I agree that that sounds like a good approach, so that’s my next step on this project. I’ll post again when I’m done!