I said I’d share my slides on my “SQL for Data Science” talk, so here they are!
I only had 40 minutes, so this wasn’t a full tutorial, and I couldn’t really teach many different concepts, but my main goal was to point out a bunch of different stuff you could do with SQL, and how to think about creating an analytical dataset, so attendees would be aware of what was possible and what they should look up if they wanted to start learning about SQL.
Enjoy!
]]>Enjoying this bot account
https://t.co/uRTj3LWgDm
— Data Science Renee (@BecomingDataSci) April 24, 2018
Today, I saw this tweet:
you could replicate this by gluing various dried out legumes to poster board if you wanted to https://t.co/icHeUuy4Ob
— Rebecca Williams (@internetrebecca) May 5, 2018
and imagined a census tract visualization made out of dried noodles and beans. Being as spontaneous as usual, I asked if anyone would be interested in having a #CraftyDataViz contest, and several people responded yes! So, here we are. Time to get creative!
Basic Contest Rules:
Find a data visualization online, in a book, or create one yourself. We need a digital version of the viz you’re recreating, so save the link or take a photo of it. Now, gather up some goodies from around the house or yard and/or hit the craft store (or maybe the grocery store!) and recreate that data viz in craft form!
It does need to be a physical end-product – no completely digital entries (though usage of printed elements is ok), but other than that there are no restrictions on materials or approach – get as creative as you want! At least part of it needs to be handmade or manually assembled (so no completely 3D-printed entries, for instance, but parts could be 3D printed) You can replicate the viz in detail, or do an abstract interpretation of it :)
I will find some judges that know something about data visualization, and they will pick winners in each of the following categories (we might do some sort of online vote to narrow down the entries, depending on how many there are):
- Most Beautiful/Visually Impressive – as long as the judges can tell it’s related to the original data viz in some way, it qualifies, and the judges will pick the overall most gorgeous or awe-inspiring outcome to win this category
- Most Informational – to win this category, your visualization needs to be especially readable/interpretable. Judges will pick the one that most effectively communicates the point of the original data viz
- Most Fun! – the definition of this is up to the judges, but if it makes the judges laugh, it probably has a good chance at winning
The winner of each category will be featured here and on my @becomingdatasci twitter account, and win their choice of item from the Becoming a Data Scientist store! By then, I’ll have the 2018 Summer of Data Science items up, since the end of this contest will also mark the launch of #SoDS18!
How to Enter:
Post a tweet (or a comment below if you don’t use twitter) that includes a link or image of the original dataviz, as well as a photo or video of your creation! On twitter, use hashtag #CraftyDataViz so I can find your entry!
The entry period starts today and ends on 11:59PM EDT on Sunday, May 27. I’ll plan to post the entries for viewing/judging on Monday, May 28 (Memorial Day in the United States).
HAVE FUN!! I’m excited to see what you create!!
]]>Feeling another set of parody lyrics coming on. Maybe will write down this week. Guess the data science theme?https://t.co/flpIozxz8x
— Data Science Renee (@BecomingDataSci) May 1, 2017
and I was reminded of it today by this tweet
Just a Neural Net
Livin' like a marionette
She took the TCP goin' anywhere
Just a chatroom bot
Born and raised on reddit thought
…— J. Nathan Matias (@natematias) July 29, 2017
So, I wrote it down to share my silliness with you. Enjoy!
I can fit every point
feature high info gain
but I’m over you asking me when you know I’m not okay
I learned really well
from the training that night
and though I can classify you know I’m just not right
I can’t generalize
I’m overfit
Too complex
I’m overfit
Tricked by noise
I’m overfit
I’m overfit
I’m over
Wanting you to be wanting me
But, my low accuracy
To outliers I’m sensitive
Because I’m so over
I’m overfit
Moving on, it’s too late
I didn’t pass cross validate
Tried so hard to relate
and now I’m so… so overfit!
You can go get more points
Build more models to help
You can regularlize with layers that drop out
Oh that’s why I’m done
I’m overfit
Was fun but
I’m overfit
I’m not the one
I’m overfit
I’m overfit
I’m over
Wanting you to be wanting me
But, my low accuracy
To outliers I’m sensitive
Because I’m so over
I’m overfit
Moving on, it’s too late
I didn’t pass cross validate
Tried so hard to data relate
and now I’m so… so overfit!
Don’t ask me to classify
Ain’t no use don’t ask me why
I’ll never change
Unless… tweak my parameters and run me again
Wanting you to be wanting me
But, my low accuracy
To outliers I’m sensitive
Because I’m so over
I’m overfit
Moving on, it’s too late
I didn’t pass cross validate
Tried so hard to relate
and now I’m so… so overfit!
(P.S. here’s the Wikipedia article on overfitting in machine learning!)
]]>Thanks to my generous Patreon supporters, I can hire someone to help me out 8-20 hours per month, paying $15/hr. More info and application form at this link.
Please let me know if you have any questions or if there are any problems with the form. Email me at renee@becomingadatascientist.com or tweet me at @becomingdatasci.
I look forward to reading the applications!!
]]>tl;dr: Boosting ensemble algorithms in Machine Learning use an approach that is similar to assembling a diverse team with a variety of strengths and experiences. If machines make better decisions by combining a bunch of “less qualified opinions” vs “asking one expert”, then maybe people would, too.
Why is this post on this blog?
I’ve been thinking a lot about diversity in tech lately. After the #FBNoExcuses conversations on twitter, I was motivated to start UntappedPipeline.com (on twitter:@untappdpipeline) because I know so many awesome women and people of color in tech, and it amazes me that some companies seem to think they are so rare and hard to find (hence using the “pipeline problem” as an excuse for not having a diverse workforce).
Of course, “diversity” can mean a lot of things: gender diversity, racial/ethnic diversity, diversity of educational backgrounds, etc. – but it all really comes down to diversity of culture/thoughts. If you are interested in learning more about diversity in tech and the benefits of hiring diverse teams, check out the Resources page on UntappedPipeline.com. Here’s one study in particular that highlights the economic benefits of a diverse tech workforce: Decoding Diversity (Dalberg/Intel, PDF).
So if this post is about diversity, why am I writing it on my “Becoming a Data Scientist” blog instead of at Untapped Pipeline? Because I’ve been doing some machine learning lately that I just realized is a great metaphor for the benefits of hiring diverse teams, and this is also an opportunity to explain a data science concept. Additionally, I’ve been talking about data science teams for a long time, and one of my motivations for starting the Becoming a Data Scientist podcast was to feature the many paths people take to data science, because data science in itself is an interdisciplinary job that requires a variety (diversity) of experience: primarily in statistics, computer programming, and “business” (or domain knowledge), but really there is a very broad set of skills that come into play when doing data science, and no one has them all (relevant rant by @quominus). I will list some references about building Data Science teams at the end of the post.
There are two machine learning algorithms I’ve used recently that illustrate the specific “ensemble learning” concept I want to focus on: Random Forest and Gradient Boosting Classifiers.
Random Forest
A Random Forest Classifier works like this: You may have heard of Decision Trees, which are pretty much just “if then” classifiers that end up generating a set of rules: “If Attribute 1 is in this range of values, and Attribute 2 is this boolean value, and Attribute 3 is greater than this value, then out of all of the possible results, this one is most likely.” Every example you feed into it will drop into one of the possible outcomes, with a certain probability of being correct. The article “A Visual Introduction to Machine Learning” has a great animated illustration of how decision trees work.
What a Random Forest does is build up a whole bunch of “dumb” decision trees by only analyzing a subset of the data at a time. A limited set of features (columns) from a portion of the overall records (rows) is used to generate each decision tree, and the “depth” of the tree (and/or size of the “leaves”, the number of examples that fall into each final bin) is limited as well. So the trees in the model are “trained” with only a portion of the available data and therefore don’t indivisually generate very accurate classifications.
However, it turns out that when you combine the results of a bunch of these “dumb” trees (also known as “weak learners”), the combined result is usually even better than the most finely-tuned single full decision tree. (So you can see how the algorithm got its name – a whole bunch of small trees, somewhat randomly generated, but used in combination is a random forest!)
When you combine multiple methods to determine a result in machine learning, it is called ensemble learning. In particular, when you use a bunch of weak learners and combine them by having them vote on the outcome (whichever outcome occurs most often for a particular record wins), iteratively improve the outcome, or average the results in some way to create a result that is stronger than any single-pass approach, that is called boosting.
Gradient Boosting
Another type of boosting is called Gradient Boosting. The approach is actually very similar to the Random Forest algorithm, except (as far as I understand it), it uses a type of optimization called Gradient Descent, which minimizes a loss function. Basically, each time it generates a decision tree, it’s using what it learned the last time it generated one to make the next one a little less bad (reducing cost/loss).
I’m not going to go to far into the technical details here, partially because that’s not really the point of this article, and partly because I start having flashbacks to my Optimization class in grad school, which was not a happy experience.
There are other boosting algorithms like Adaptive Boosting (AdaBoost) and other ensemble methods in machine learning to explore. Some of them are described in the scikit-learn (machine learning python package) documentation if you want to learn more.
So back to my original point
Now that I have the explanations out of the way, I can get back to the point I wanted to make. Notice how these algorithms work. Each “weak learner” only has some of the information needed to make a good guess to classify something. In fact, they’re often incorrect on their own, because they just don’t have the experience that a big “solo” algorithm has with the data. (Imagine a bunch of weird-looking small trees vs one big gorgeous well-developed oak tree.) However, when you combine the wide variety of partial experiences that the “weak learners” provide, their combined guess turns out to actually be better than the guess made by the one big fully-formed tree.


So, think of the same concept for building a Data Science Team. There is currently a shortage of “experts” in data science, and most companies don’t seem to know what kind of data scientist they need anyway. Some companies are lamenting the lack of “qualified” data scientists (i.e. “unicorns” that have all of the necessary skills and experience already), while in the meantime, there are plenty of business analysts, software developers, UX designers, subject matter experts, people that do similar work in other fields (like biotechnology, cognitive science, etc etc etc), and people that are on their way to becoming data scientists and only have a portion of the requisite skills and knowledge. Some companies are just “pattern matching” and trying to hire people that are exactly like their existing successful employees (though it’s unlikely they have even defined what they mean by “successful employees”).
However, if you know how to find creative and motivated “go-getters” that want to learn on the job and contribute to a team, and each person on the team has a portion of the needed experience and skills, there is a good chance that in combination (if given good support and resources!) that a small group of “junior data scientists with other relevant skills” will actually turn out better than hiring one or two “experts” in the first place. Plus, they cost less. Plus, they are likely very trainable. Plus, they really want to make a difference and prove themselves as capable data scientists.
Anyway, I’m making a lot of generalizations here, and need to go back and fill in some of my comments in this last section with references, but you can see what I’m getting at. For those in tech that have a really hard time believing that that “scrappy new business analyst” with a non-terminal non-computer-science degree from a non-ivy-league school that doesn’t have many years of experience doing the exact kind of work you want them to do at your company won’t be “qualified” to fill a Data Science position, maybe it will help to think of the problem as one that Boosting will solve. Create an “ensemble” of “learners” that may individually only have a subset of the experience and may be self-taught and not do everything the “right” way when tasked to do it alone, but can each contribute their wide variety of experiences and skills to come up with a final solution as a team. I’m willing to bet that the solutions generated by a diverse group with less-than-ideal credentials (but a wider breadth of experience) will turn out better than what an “expert” (or homogenous group) would come up with on their own anyway, because the research shows that it usually does. Just do the math.
[more links about building data science teams to be added]
]]>I posted earlier about using the UsesThis API to retrieve data about what other software people that use X software also use. I thought I was going to have to code a workaround for people that didn’t have any software listed in their interviews, but when I tweeted about it, Daniel from @usesthis replied that it was actually a bug and fixed it immediately! It makes it even more fun to develop since he is excited about me using his API!
@BecomingDataSci: YES! It’s *awesome*.
— The Setup (@usesthis) June 19, 2015
After seeing those results, I thought it would be interesting (and educational) to learn how to do a Market Basket Analysis on the software data. Market Basket Analysis is a data mining technique where you can find out what items are usually found in combination, such as groceries people typically buy together. For instance, do people often buy cereal and milk together? If you buy taco shells and ground beef, are you likely to also buy shredded cheese? This type of analysis allows brick and mortar retailers to decide how to position items in a store. Maybe they will put items regularly purchased together closer together to make the trip more convenient. Maybe they will place coupons or advertisements for shredded cheese next to the taco shells. Or maybe they will place the items further apart so you have to pass more goods on the way from one item to the other and are more likely to pick up something you otherwise wouldn’t have. Online retailers can use this type of analysis to recommend products to increase the size of your purchase. “Other customers that added item X to their shopping cart also purchased items Y and Z.”
Because I had this interesting set of software usage from The Setup’s interviews, I wanted to analyze what products frequently go together. I searched Google for ‘Market Basket Analysis python,’ and it led me to this tweet by @clayheaton:
I just wrote a simple Market Basket analysis module for Python. #analytics https://t.co/aVf58zcHJa
— Clay Heaton (@clayheaton) April 4, 2014
I followed that link and checked out the code on github and it seemed to make sense, so I put the results of my usesthis API request into a format it could use. I did a test with the data from 5 interviews, and it ran. Then I tried 50 interviews, and the results showed that people that use Photoshop were likely to also use Illustrator, and vice-versa. It appeared to be working!
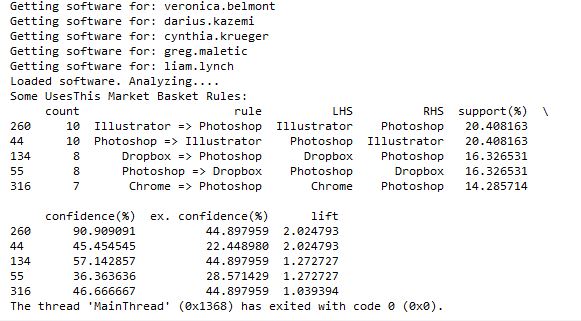
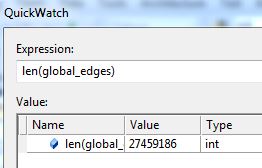
However, I then hit a snag. I tried to run it with all of the software data, and it ran for a long time then crashed when my computer ran out of memory. Since it’s building an association graph with an edge for every rule (combination of software used), with up to two pieces of software per “side” of the rule (such as “people that have Photoshop and Illustrator also have a Mac”), you can imagine the graph gets pretty big when you have over 10,000 user-software combinations.
I tweeted about this and Clay suggested modifying his code to store the items in a sparse matrix instead of a graph, and I agree that that sounds like a good approach, so that’s my next step on this project. I’ll post again when I’m done!
]]>