Feeling another set of parody lyrics coming on. Maybe will write down this week. Guess the data science theme?https://t.co/flpIozxz8x
— Data Science Renee (@BecomingDataSci) May 1, 2017
and I was reminded of it today by this tweet
Just a Neural Net
Livin' like a marionette
She took the TCP goin' anywhere
Just a chatroom bot
Born and raised on reddit thought
…— J. Nathan Matias (@natematias) July 29, 2017
So, I wrote it down to share my silliness with you. Enjoy!
I can fit every point
feature high info gain
but I’m over you asking me when you know I’m not okay
I learned really well
from the training that night
and though I can classify you know I’m just not right
I can’t generalize
I’m overfit
Too complex
I’m overfit
Tricked by noise
I’m overfit
I’m overfit
I’m over
Wanting you to be wanting me
But, my low accuracy
To outliers I’m sensitive
Because I’m so over
I’m overfit
Moving on, it’s too late
I didn’t pass cross validate
Tried so hard to relate
and now I’m so… so overfit!
You can go get more points
Build more models to help
You can regularlize with layers that drop out
Oh that’s why I’m done
I’m overfit
Was fun but
I’m overfit
I’m not the one
I’m overfit
I’m overfit
I’m over
Wanting you to be wanting me
But, my low accuracy
To outliers I’m sensitive
Because I’m so over
I’m overfit
Moving on, it’s too late
I didn’t pass cross validate
Tried so hard to data relate
and now I’m so… so overfit!
Don’t ask me to classify
Ain’t no use don’t ask me why
I’ll never change
Unless… tweak my parameters and run me again
Wanting you to be wanting me
But, my low accuracy
To outliers I’m sensitive
Because I’m so over
I’m overfit
Moving on, it’s too late
I didn’t pass cross validate
Tried so hard to relate
and now I’m so… so overfit!
(P.S. here’s the Wikipedia article on overfitting in machine learning!)
]]>Machine Learning Algorithm
A machine learning algorithm is a list of instructions to guide a computer to analyze some data to find patterns, and works much like a cooking recipe. You put some data in (ingredients), do some stuff to it (preparation and cooking), and then evaluate how the results compare to what you were hoping to accomplish (photo in your cookbook and expectations of taste).
Input Columns (Features) -> Ingredients
Features are basically columns in your spreadsheet that you choose to input into an algorithm, and they’re like ingredients in a recipe. If you’re going to make cookies, you’ll need some ingredients like eggs, flour, and chocolate. These ingredients get stirred together and then baked, and the output is a (hopefully) edible cookie.
Feature Engineering -> Ingredient Prep
Some ingredients, like eggs, aren’t added to the recipe as-is. You have to crack the egg, sometimes separate the whites from the yolk, and maybe beat the egg before adding it to your recipe. The same goes for the features, or columns in your spreadsheet. For instance, you might have a column that contains categorical values in text form, and some algorithms will require you to first transform that column into a bunch of yes/no columns that “encode” the feature into binary values. If, for instance, you have category values listed in your original column like “category A”, “category B”, and “category C”, you might convert the 1 column to 3 columns – one for each category – and instead of the spreadsheet cells containing words, they now contain a 1 or a 0 in each category column indicating “yes” or “no” for each category. An algorithm that couldn’t understand the phrase “category A”, can now understand it as a value of “1” in the Category A column.
Number of Input Rows / Volume of Data -> Batch Size
Changing the number of rows of data in your spreadsheet (each row containing a bunch of “features” – or columns) is like scaling the measure of ingredients in your recipe. If you want a double batch of cookies, you can add twice as much of each ingredient into your bowl, and get twice the cookie dough. If you only have half of the amount of flour called for by the recipe, you can halve all of the other ingredients to get half of a batch. You have to beware of modifying how many rows of data you input into your algorithm, though. Like in cooking, adding or removing rows can sometimes have an unexpected effect on the output. If you split a bowl of cookie dough in half, but almost all of the chocolate chips end up in one half and almost none are in the other half, you won’t get two identical batches of cookies! The distribution of values contained in the rows of data you input into your machine learning algorithm impacts the resulting model.
Clean CSV -> Pre-prepared meal kit
In data science courses, you often start assignments with a pre-cleaned spreadsheet. This is like receiving a meal kit delivered to your door. You get the correct amount of each ingredient, and they are often already prepared or just need a little chopping. This is great for learning, but don’t be surprised when you get to a real-world scenario and you are expected to shop for the ingredients, hope they are available for purchase at your local store, make some substitutes, and then figure out how each ingredient you bought needs to be transformed in order for the recipe to work! It makes sense to start out as a short-order cook before you learn the skills and art to being a chef, so there’s nothing wrong with using “meal kits” to start out!
Type of Model/Algorithm -> Cooking method
Now that you have all of your ingredients prepared, what do you do with them? If you’re cooking, that batter could be baked into a cake, or fried into a donut. If you’re doing data science, your spreadsheet could be run through a variety of algorithms to generate different types of models, to see how each turns out. This is called “model selection”. You might use linear regression or a decision tree, for instance. Just like with cooking, different “ingredients” (features) work better with certain cooking styles (types of models). And some people – machine learning researchers – are exploring entirely new methods of “cooking”!
Model Parameters -> Cooking settings
Now that you’ve chosen to bake your cookies, at what temperature do you bake them at? And for how long? This depends on what you are trying to optimize for. Do the people eating the cookies like them more caramelized and don’t mind them being a little burnt around the edges? Or do they like them soft with no dark spots? Some of that is affected by the ingredients you put in, but it’s important to find a good oven temperature and cooking time combination. In machine learning, this is called “parameter tuning” or “hyperparameter optimization”. There are methods for working through different combinations of parameters (settings) to find the best one for the outcome you want to achieve. Note that if you change the ingredients (features), the settings that worked with your last batch of dough may not be the best for your new one. And a good temperature for frying might not be a good temperature for baking!
Also note that I mentioned you have to choose what to optimize for. If you have an audience that has different cookie preferences, you can tweak your model toward one or the other, or try to balance between the two. There are always human choices made in “machine learning”, and every choice is a trade-off! (same goes for choosing which rows and columns to input into your model, not just parameters)
Output Features / Target Variable -> Ideal Cooked Food Outcome
We talked about input features (ingredients), but why are we doing all this “cooking”? We’re trying to achieve some sort of target, which we mentioned a bit earlier when talking about parameter tuning. How do we know what target we’re trying to hit? In supervised machine learning, you have some rows where the output is known, so you can train your model. This is like having a photo of the finished product in a cookbook, and having tasted what a good outcome of the recipe tastes like. You have a target toward which you are trying to optimize. If you say it is “too salty”, you’re comparing the saltiness of your result to some ideal saltiness. That ideal is the “target”, and in supervised machine learning, is encoded in the “output feature” – a column in your spreadsheet that contains a value for each row that identifies how that row should be categorized by the resulting model, or what number the algorithm should generate.
Model Evaluation -> Tasting/Looking at Result, Comparing to Recipe Expectations
Once you’ve run your features through a model (cooked your ingredients with a particular method and settings), you need to evaluate how well the results turned out. In cooking, you’ll often have some taste-testers and you can also compare how the final plated dish looks when compared to the photo in the cookbook. As mentioned before, you can optimize for different things. You might make a dish that looks beautiful – exactly like the photo! – but tastes horrible. (Maybe they staged the photo with fake food and no one can make it look like that with the given recipe!)
So, if your “evaluation metric” of taste is way off, you go back and tweak your ingredients (features), ingredient prep (feature engineering), parameters (oven settings), and batch size (volume of data and which rows are included) until your outcome meets your chosen ideal. Or, if you think the outcome is just fine, it might be the taste testers (metrics) that need rethinking!
———————–
Types of machine learning algorithms.
These next few examples get away from the “recipe” example I’ve been using so far, but still use food to attempt to explain the concepts.
Imagine that you have a big bowl of trail mix. Your job is to teach a child to separate the trail mix into its components. This is like taking a big spreadsheet of data, and figuring out how to group the rows into categories. Each piece in the trail mix corresponds to one row in your spreadsheet.
You notice that the bowl of trail mix contains nuts, candy, and pieces of cereal. You point out each ingredient to the child, explaining “see, this is a peanut, a type of nut”, “this is an M&M, a type of candy”, tell the child to separate them out into piles, and walk away. (Don’t be surprised if some of your “data” is missing after this project!)
CLASSIFICATION
You come back and see that the child has created two piles: One has peanuts, cashews, and almonds in it. The other has M&Ms, chex, cheerios, and raisins in it. This child understood the task as a classification task, and acted as a “nut or not” classifier! He heard you describing the items as nuts, candy, or cereal, ignored the specifics, and decided to do a simple separation into 2 piles: one with nuts, one with non-nuts.
I could go into detail here about confusion matrices and evaluating this child’s performance, categorizing true positives (nuts correctly identified as nuts), false positives (non-nuts identified as nuts), true negatives (non-nuts identified as non-nuts), and false negatives (nuts identified as non-nuts), but getting into the details of these measures would make this article way longer than it needs to be, and I’m just trying to cover the high-level types of algorithms.
This “nut classification” algorithm worked because the child identified features of the items that made certain pieces nut-like (hard, brown, salty), and features that made them non-nut-like, and categorized them into piles based on how nut-like they were.
Even though you left the child unsupervised during this process, the type of machine learning is called “supervised learning“, because you first told the kid what each item was, so he had “labels” for what was a nut and what was not a nut, to learn which features went with each classification.
CLUSTERING
You call over another child. You decide not to tell her anything about the items in the bowl, but tell her that she needs to divide the items in the bowl into piles, hoping she’ll separate them into nuts, candy, and “other”, but not telling her that. You want her to do more than just the “nut or not” that the first kid did, so you tell her to divide them into at least 3 groups. Because you didn’t tell her information about how to categorize each item in the bowl, this is an example of “unsupervised learning” (even if you watch her do it).
She stares at the bowl for a while, and you leave her alone to do the task. When you come back, there are 3 piles. One has nuts, raisins, cereal, and brown M&Ms in it, and then there is a pile for each color of M&Ms! She has “clustered” the items based on color similarity. She gave you more than 3 groups, but since you didn’t label the items, she picked color as what made the items most similar to one another. So you got a large brown pile that contained most of what was in the bowl (since most of the trail mix was brown), then small piles of blue, red, orange, yellow, and green M&Ms.
REGRESSION
You decide to try the same exercise and call over a third child. This time, you just tell the kid to organize the bowl however she wants, and watch from a distance. To your dismay, she is licking every piece! You rush over and see that she has lined up all of the pieces on the ground. Most of the M&Ms are toward one side of the line, and as you go down toward the other end of the line, you see mostly nuts and cereal. “What were you licking them for?,” you say. “Well duh, I had to see how sweet they each were!” she replies. She has sorted them in one dimension – testing only for sweetness, and ordering every piece into a line based on how sweet it was.
This isn’t the best example of regression – but the point is that you got a value as an output – sweetness level – as opposed to a category. It’s possible to use this sweetness level to then create categories – like creating a “candy” category by picking a certain sweetness level, and saying that anything above that is candy.
If you are given a new piece of trail mix, you could compare it to trail mix in the already-licked line, and probably make a good guess about how sweet it is based on how much it looks like the pieces in a particular part of the line.
I hope this helps clarify some machine learning terminology for people who like food metaphors! Add your own food-machine learning metaphors or ask questions in the comments!
]]>Renee interviews Randal S. Olson, Senior Data Scientist in the Institute for Biomedial Informatics at UPenn, about his path to becoming a data scientist, his interesting data science blog posts, and his work with non-data-scientists and students.
Podcast Audio Links:
Link to podcast Episode 16 audio
Podcast’s RSS feed for podcast subscription apps
Podcast on Stitcher
Podcast on iTunes
Podcast Video Playlist:
Youtube playlist of interview videos
More about the Data Science Learning Club:
Data Science Learning Club Welcome Message
Data Science Learning Club Activity 16 – Genetic Algorithms
Data Science Learning Club Meet & Greet
Mentioned in the episode:
Dr. Kenneth Stanley at the University of Central Florida
Michigan State University Artificial Intelligence
BEACON NSF Science and Technology Center at MSU
- Here’s Waldo: Computing the optimal search strategy for finding Waldo
- Computing the Optimal Road Trip Across the U.S.
- Computing Optimal Road Trips on a Limited Budget
- Machine Learning Madden NFL
Moneyball (book)
Data Science Handbook (book)
]]> ]]>
]]>(Readers told me that the link above doesn’t discount at all for International shipping, so if you are outside the US, use this link for $3.99 off – equivalent to US Shipping cost)
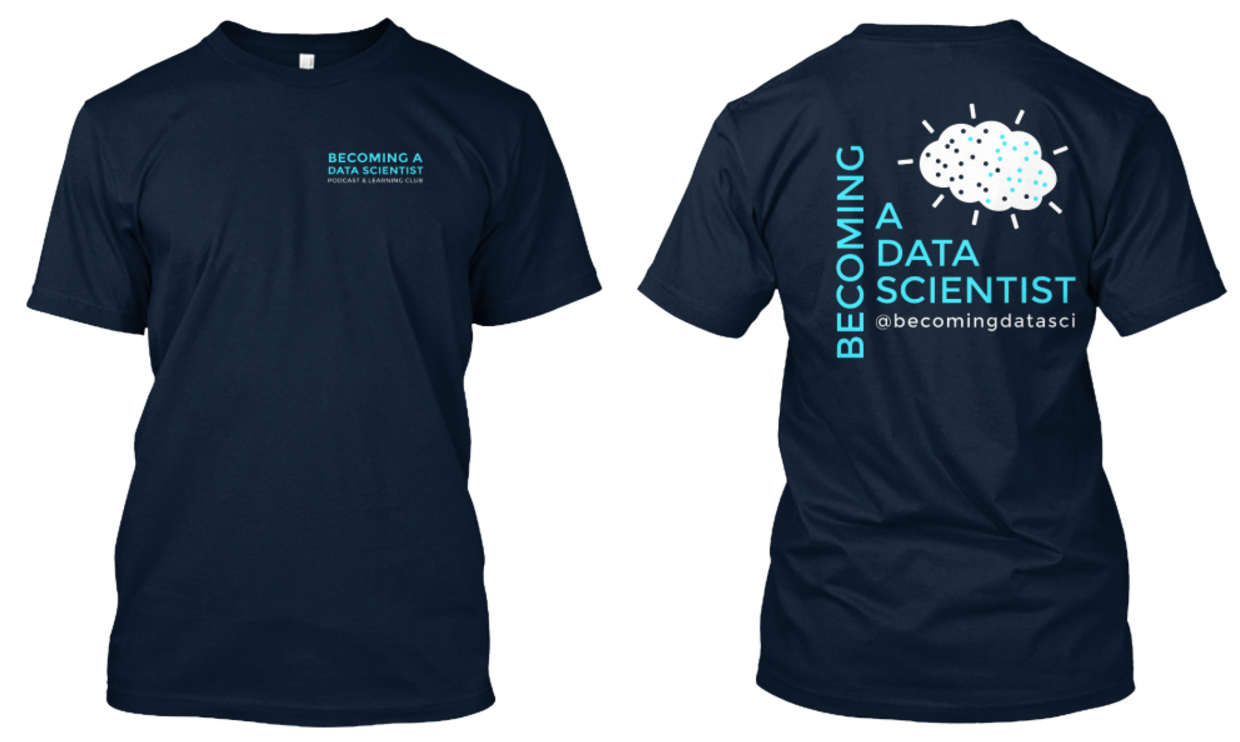
The design is a combination of those submitted to our contest by Amarendranath “Amar” Reddy and Ryne & Alexis. You can see their design submissions and read more about them on the finalists post! They are each receiving prizes for being selected. Thanks Amar, Ryne, and Alexis for the awesome design!
There are a variety of styles and colors available. The Premium Tee is 100% cotton. The Women’s Premium is a 50/50 cotton/poly blend, and is cut to fit more snugly. They are available in navy blue, gray, purple, and black. There’s even a long-sleeve version!
I make anywhere from $2-$7 on each order (it’s print-on-demand, so not cheap enough for me to make a significant profit yet, and my proceeds will be lower with the free shipping offer, but I want to reward those of you who are excited to flaunt your Becoming a Data Scientist status!) and every dollar earned from these will be going to the fund that helps support my new small team of assistants, who you’ll meet soon! Also, the more of them I sell, the lower the cost to print is per shirt, so please share with all of your friends!
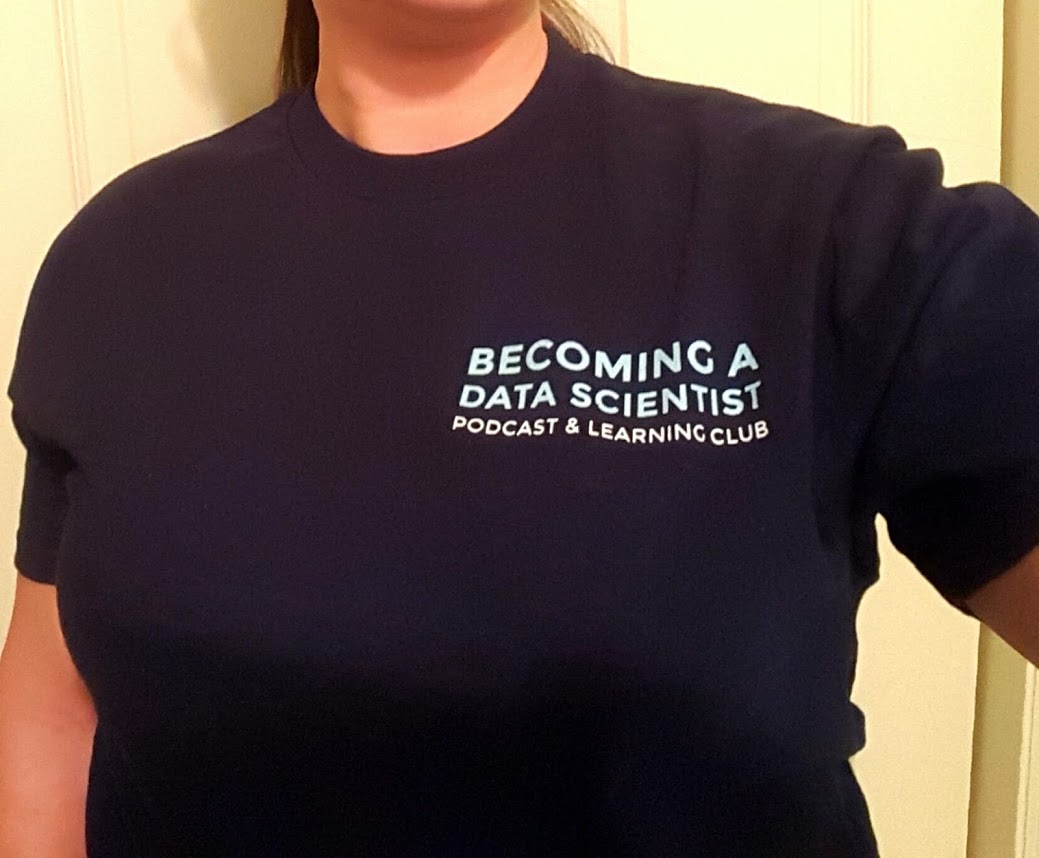
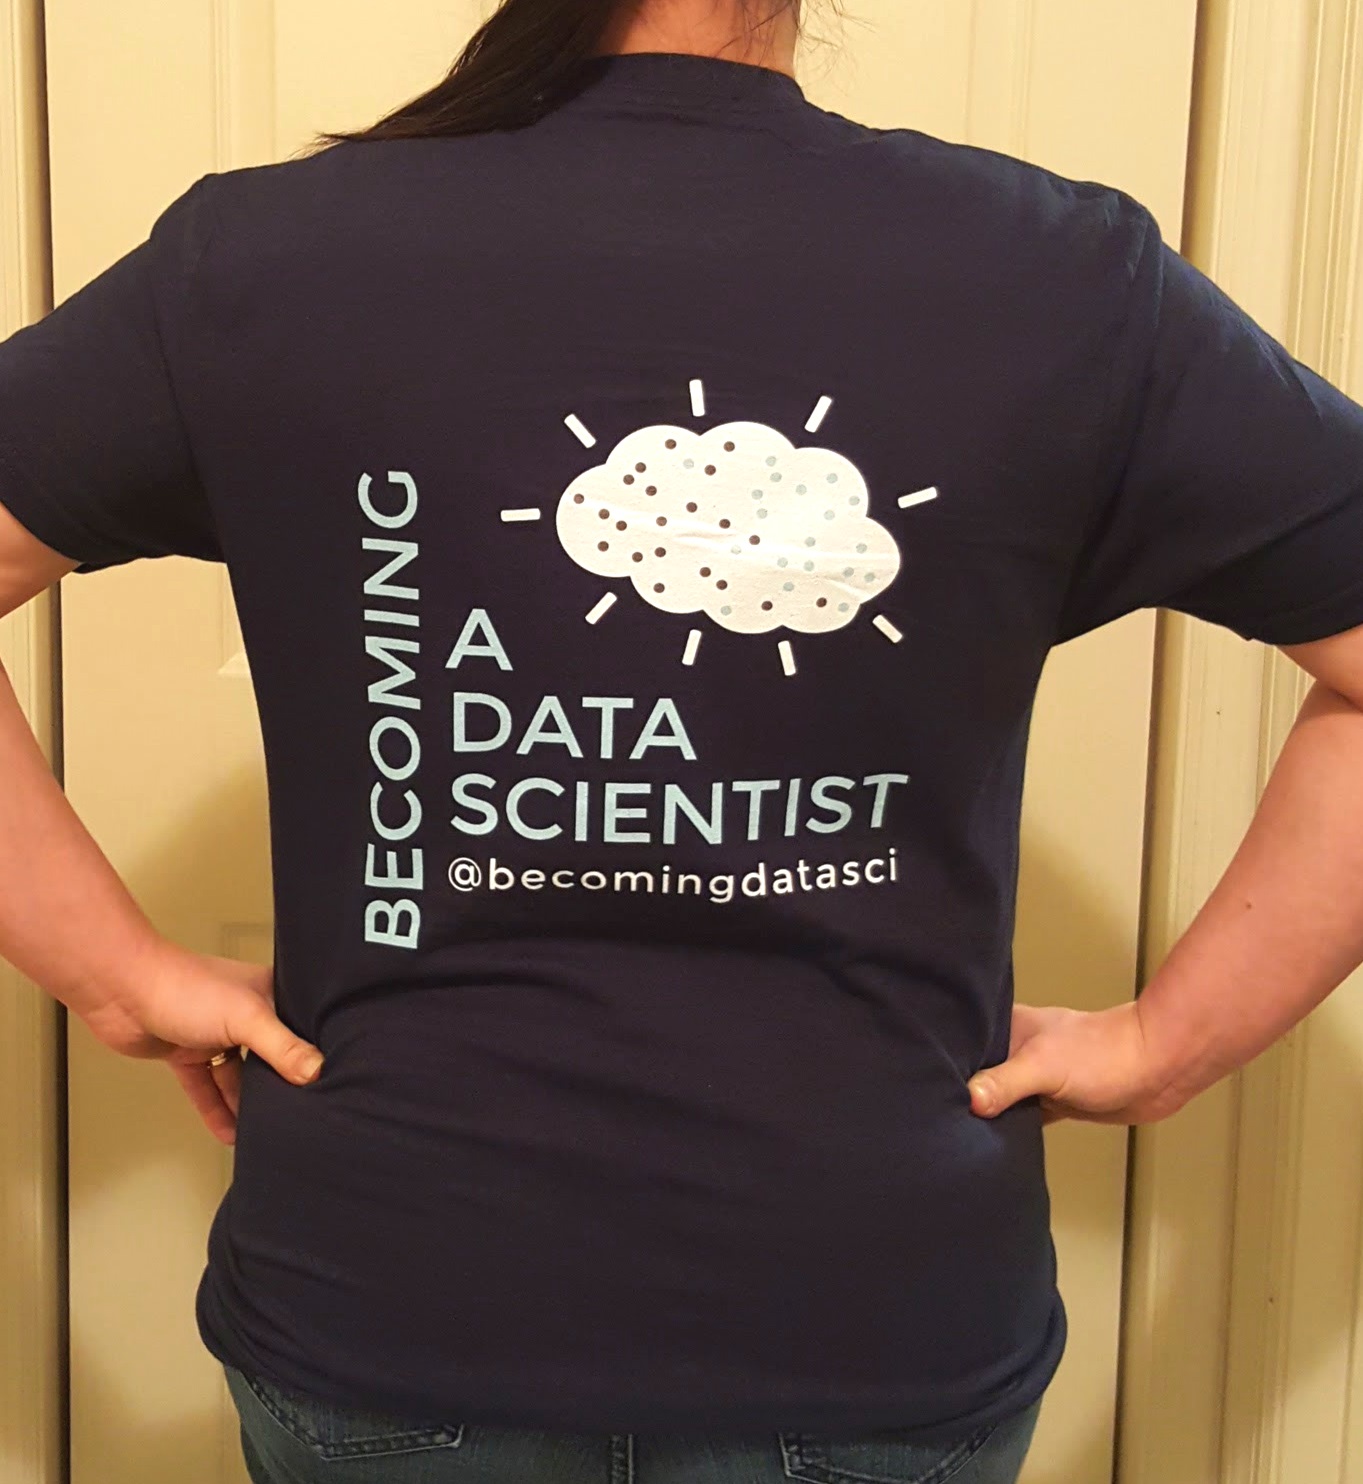
Here are photos of me wearing the shirt, but this was before I made the front design slightly smaller (so it doesn’t wrap into armpit), and I moved the back design slightly higher and also made the gray dots (data points?) transparent so the color of the shirt will show through there now (see store images above for current design). You can see that the teal came out as a lighter blue in printing. This is the “Premium Tee” style in “New Navy”.
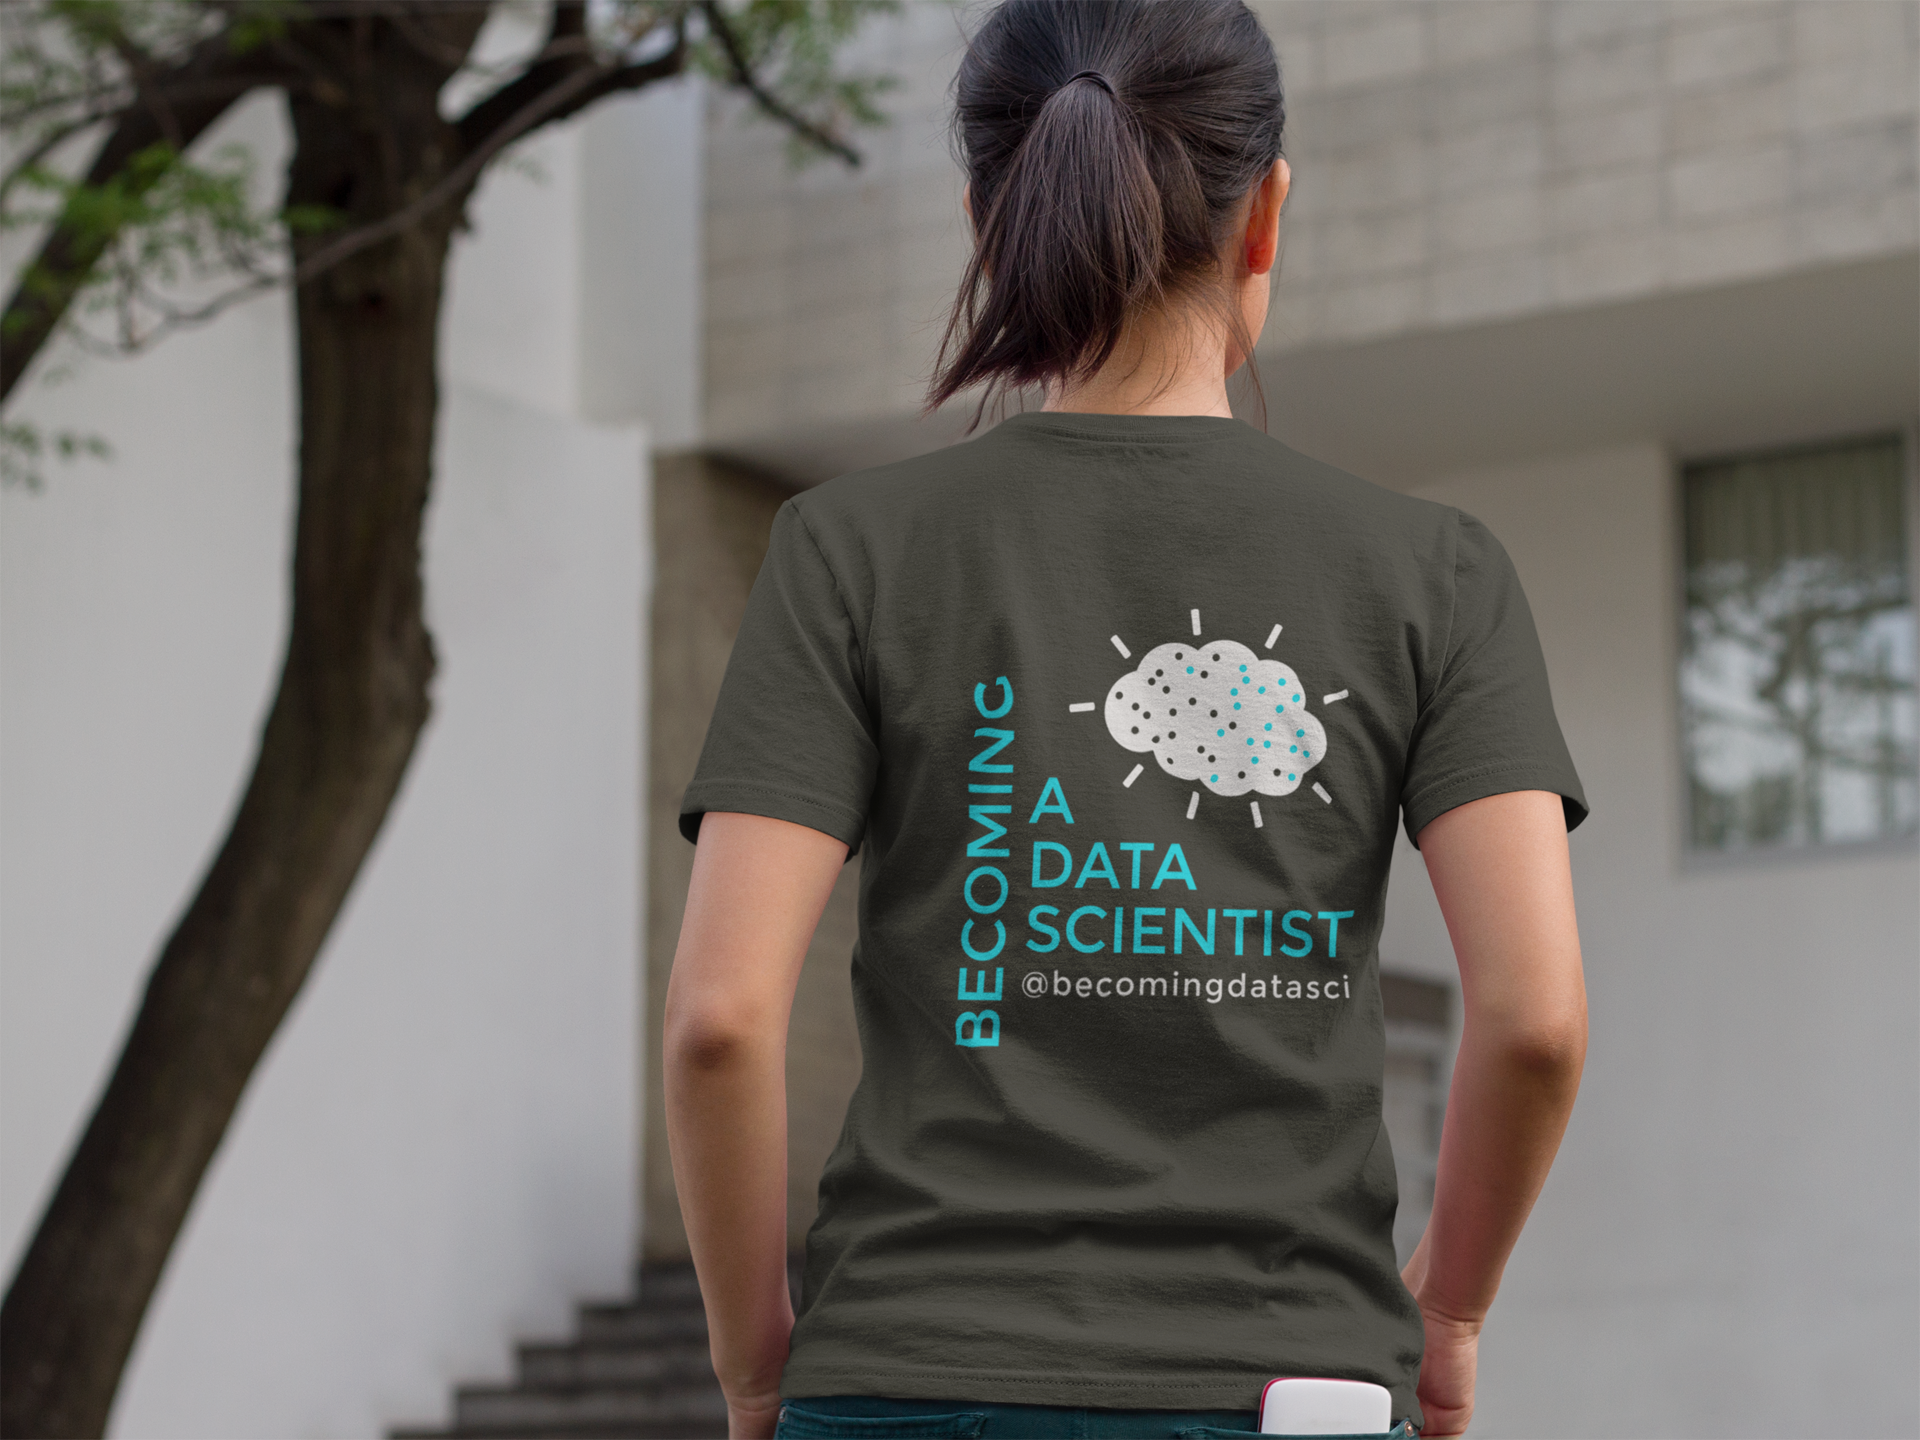
Here’s a model wearing a simulated version of the shirt.
Order yours here, with Free Shipping Until March 1!
 ]]>
]]>David Meza is Chief Knowledge Architect at NASA, and talks to Renee in this episode about his educational background, his early work at NASA, and examples of his work with multidisciplinary teams. He also describes a project involving a graph database that improved search capabilities so NASA engineers could more easily find "lessons learned".
Podcast Audio Links: Link to podcast Episode 15 audio Podcast's RSS feed for podcast subscription apps]]>
David Meza is Chief Knowledge Architect at NASA, and talks to Renee in this episode about his educational background, his early work at NASA, and examples of his work with multidisciplinary teams. He also describes a project involving a graph database that improved search capabilities so NASA engineers could more easily find “lessons learned”.
Podcast Audio Links:
Link to podcast Episode 15 audio
Podcast’s RSS feed for podcast subscription apps
Podcast on Stitcher
Podcast on iTunes
Podcast Video Playlist:
Youtube playlist of interview videos
More about the Data Science Learning Club:
Data Science Learning Club Welcome Message
Data Science Learning Club Activity 15 – Explain an Analysis (Communication)
Data Science Learning Club Meet & Greet
Mentioned in the episode:
NASA Knowledge (@NASAKnowledge on twitter)
Engineering Management
Knowledge Management
Organizational Learning
Knowledge Engineering
Information Architecture
Data Analysis
Neo4j
Elasticsearch
IHS Goldfire
MongoDB
@davidmeza1 on Twitter
David Meza on LinkedIN
Southern Data Science Conference in Atlanta, GA on April 7, 2017 (Coupon code RENEE takes 15% off ticket price)
]]>Episode Audio (mp3) – also available on iTunes, Stitcher, etc.
(note, there is no video for this episode)
On the panel:
]]>Stephanie Rivera has worked in machine learning and data science for academic research (at University of Tennessee), for the government (Department of Defense), for a large consulting firm (Booz Allen), and now for a startup (MyStrength). In the interview, she discusses her career path, her experiences with mentorship, and her role in authoring The Field Guide to Data Science and the Explore Data Science online course. Podcast Audio Links: Link to podcast Episode 11 audio Podcast's RSS feed for podcast subscription apps Podcast on Stitcher Podcast on iTunes Podcast Video Playlist: Youtube playlist of interview videos]]>
Stephanie Rivera has worked in machine learning and data science for academic research (at University of Tennessee), for the government (Department of Defense), for a large consulting firm (Booz Allen), and now for a startup (MyStrength). In the interview, she discusses her career path, her experiences with mentorship, and her role in authoring The Field Guide to Data Science and the Explore Data Science online course.
Podcast Audio Links:
Link to podcast Episode 11 audio
Podcast’s RSS feed for podcast subscription apps
Podcast on Stitcher
Podcast on iTunes
Podcast Video Playlist:
Youtube playlist of interview videos
More about the Data Science Learning Club:
Data Science Learning Club Welcome Message
[learning club activity coming soon]
Data Science Learning Club Meet & Greet
Links to topics mentioned by Stephanie in the interview:
Total Domination in Graph Theory (pdf)
Some research publications by Stephanie:
Machines Watch you Surf the Web
Total domination dot-stable graphs
The University of Tennessee Knoxville Center for Intelligent Systems and Machine Learning (CISML)
UTK Distributed Intelligence Laboratory
UTK Infant Perception Action Laboratory
Natural Language Processing (NLP)
Explore Data Science (now via Metis)
]]>Trey Causey is a data scientist with a background in psychology and sociology who, like Renee, is from Virginia. He has worked as a data scientist at a range of companies from zulily to ChefSteps, and has also developed some interesting sports analytics projects, including the New York Times 4th Down bot. Trey also has advice for people wanting to start a career in data science. Podcast Audio Links: Link to podcast Episode 10 audio]]>
Trey Causey is a data scientist with a background in psychology and sociology who, like Renee, is from Virginia. He has worked as a data scientist at a range of companies from zulily to ChefSteps, and has also developed some interesting sports analytics projects, including the New York Times 4th Down bot. Trey also has advice for people wanting to start a career in data science.
Podcast Audio Links:
Link to podcast Episode 10 audio
Podcast’s RSS feed for podcast subscription apps
Podcast on Stitcher
Podcast on iTunes
Podcast Video Playlist:
Youtube playlist of interview videos
More about the Data Science Learning Club:
Data Science Learning Club Welcome Message
[learning club activity coming soon]
Data Science Learning Club Meet & Greet
Links to topics mentioned by Trey in the interview:
Commodore VIC-20
Bulletin Board
C++
Pascal
BASIC
Virginia Tech
Odyssey of the Mind
University of Washington Sociology
Complexity Theory and organizations
[more links to come! …sorry for all of the delays on getting this episode out! -Renee]
]]>Renee interviews computational biologist, author, data scientist, and Michigan State PhD candidate Sebastian Raschka about how he became a data scientist, his current research, and about his book Python Machine Learning. In the audio interview, Sebastian also joins us to discuss k-fold cross-validation for our model evaluation Data Science Learning Club activity.
Podcast Audio Links:
Link to podcast Episode 8 audio
Podcast’s RSS feed for podcast subscription apps
Podcast on Stitcher
Podcast on iTunes
Podcast Video Playlist:
Youtube playlist of interview videos
More about the Data Science Learning Club:
Data Science Learning Club Welcome Message
Learning Club Activity 8: Evaluation Metrics [coming soon]
Data Science Learning Club Meet & Greet
Links to topics mentioned by Sebastian in the interview:

Sebastian’s Python Machine Learning repository on GitHub
Python Machine Learning Book on DataSciGuide
scikit-learn – Voting Classifier
logistic regression (from Sebastian’s github)
regularization in logistic regression (from Sebastian’s github)
@rasbt on Twitter
Sebastian Raschka on Quora
Sebastian’s book on Amazon:

Data Scientist, Author, and manager of data science teams Enda Ridge talks to us about data governance, data provenance, reproducible analysis, work pipelines and products, and people, among other topics covered in his book “Guerrilla Analytics – A practical Approach to Working with Data: The Savvy Manager’s Guide”.
Podcast Audio Links:
Link to podcast Episode 7 audio
Podcast’s RSS feed for podcast subscription apps
Podcast on Stitcher
Podcast on iTunes
Podcast Video Playlist:
Youtube playlist of interview videos
More about the Data Science Learning Club:
Data Science Learning Club Welcome Message
Learning Club Activity 7: Linear Regression [coming soon]
Data Science Learning Club Meet & Greet
More show Notes Coming Soon!
Enda’s book on Amazon:

Renee Teate interviews Clare Corthell, founding partner of summer.ai (now Luminant Data) and creator of the Open Source Data Science Masters curriculum, about becoming a data scientist.
Podcast Audio Links:
Link to podcast Episode 5 audio
Podcast’s RSS feed for podcast subscription apps
Podcast on Stitcher
Podcast on iTunes
Podcast Video Playlist:
Youtube playlist of interview videos
More about the Data Science Learning Club:
Data Science Learning Club Welcome Message
Learning Club Activity 5: Naive Bayes Classification
Data Science Learning Club Meet & Greet
Resources/topics mentioned by Clare in the interview:
Management Science and Engineering
Markov Chains
Science, Technology, and Society at Stanford
A Challenge to Data Scientists (blog post Renee mentioned)
Mattermark
Product Management
Machine Learning
Open Source Data Science Masters
Nate Silver’s book The Signal and the Noise
Linear Algebra (on Khan Academy)
Bill Howe’s Introduction to Data Science Coursera Course
Recurrent Neural Nets
Bayesian Networks
Open Source Data Science Masters on GitHub (pull requests welcome!)
summer.ai (Update 2/15 – Clare’s company is now Luminant Data, Inc.)
@ClareCorthell on twitter
Other links:
SlideShare Slides about Open Source Data Science Masters
Talk Clare gave at Wrangle Conference about AI Design for Humans
]]>Data scientists are problem solvers at heart, and we love our data and our algorithms that sometimes seem to work like magic, so we may be inclined to try to solve these problems stemming from human bias by turning the decisions over to machines. Most people seem to believe that machines are less biased and more pure in their decision-making – that the data tells the truth, that the machines won’t discriminate.
Most people seem to believe that machines are less biased and more pure in their decision-making – that the data tells the truth, that the machines won’t discriminate.
However, we must remember that humans decide what data to collect and report (and whether to be honest in their data collection), what data to load into our models, how to manipulate that data, what tradeoffs we’re willing to accept, and how good is good enough for an algorithm to perform. Machines may not inherently discriminate, but humans ultimately tell the machines what to do, and then translate the results into information for other humans to use.
We aim to feed enough parameters into a model, and improve the algorithms enough, that we can tell who will pay back that loan, who will succeed in school, who will become a repeat offender, which company will make us money, which team will win the championship. If we just had more data, better processing systems, smarter analysts, smarter machines, we could predict the future.
I think Chris Anderson was right in his 2008 Wired article when he said “The new availability of huge amounts of data, along with the statistical tools to crunch these numbers, offers a whole new way of understanding the world,” but I think he was wrong when he said that petabyte-scale data “forces us to view data mathematically first and establish a context for it later,” and “With enough data, the numbers speak for themselves.” To me, context always matters. And numbers do not speak for themselves, we give them voice.
To me, context always matters. And numbers do not speak for themselves, we give them voice.
How aware are you of bias as you are building a data analysis, predictive model, visualization, or tool?
How complete, reliable, and representative is your dataset? Was your data collected by a smartphone app? Phone calls to listed numbers? Sensors? In-person surveying of whoever is out in the middle of the afternoon in the neighborhood your pollsters are covering, and agrees to stop and answer their questions?
Did you remove incomplete rows in your dataset to avoid problems your algorithm has with null values? Maybe the fact that the data was missing was meaningful; maybe the data was censored and not totally unknown. As Claudia Perlich warns, after cleaning your dataset, your data might have “lost its soul“.
Did you train your model on labeled data which already included some systematic bias?
It’s actually not surprising that a computer model built to evaluate resumes may eventually show the same biases as people do when you think about the details of how that model may have been built: Was the algorithm trained to evaluate applicants’ resumes against existing successful employees, who may have benefited from hiring biases themselves? Could there be a proxy for race or age or gender in the data even if you removed those variables? Maybe if you’ve never hired someone that grew up in the same zip code as a potential candidate, your model will dock them a few points for not being a close match to prior successful hires. Maybe people at your company have treated women poorly when they take a full maternity leave, so several have chosen to leave soon after they attempted to return, and the model therefore rates women of common childbearing age as having a higher probability of turnover, even though their sex and age are not (at least directly) the reason they left. In other words, our biases translate into machine biases when the data we feed the machine has biases built in, and we ask the machine to pattern-match.
We have to remember that Machine Learning effectively works by stereotyping. Our algorithms are often just creative ways to find things that are similar to other things. Sometimes, a process like this can reduce bias, if the system can identify predictors or combinations of predictors that may indicate a positive outcome, which a biased human may not consider if they’re hung up on another more obvious variable like race. However, as I mentioned before, we’re the ones training the system. We have to know where our data comes from, and how the ways we manipulate it can affect the results, and how the way we present those results can impact decisions that then impact people.
Data scientists, I challenge you. I challenge you to figure out how to make the systems you design as fair as possible.
Data scientists, I challenge you. I challenge you to figure out how to make the systems you design as fair as possible.
Sure, it makes sense to cluster people by basic demographic similarity in order to decide who to send which marketing message to so your company can sell more toys this Christmas than last. But when the stakes are serious – when the question is whether a person will get that job, or that loan, or that scholarship, or that kidney – I challenge you to do more than blindly run a big spreadsheet through a brute-force system that optimizes some standard performance measure, or lazily group people by zip code and income and elementary school grades without seeking information that may be better suited for the task at hand. Try to make sure your cost functions reflect the human costs of misclassification as well as the business costs. Seek to understand your data, and to understand as much as possible how the decisions you make while building your model are affecting the outcome. Check to see how your model performs on a subset of your data that represents historically disadvantaged people. Speak up when you see your results, your expertise, your model being used to create an unfair system.
As data scientists, even though we know that systems we build can do a lot of good, we also know they can do a lot of harm. As data scientists, we know there are outliers. We know there are misclassifications. We know there are people and families and communities behind the rows in our dataframes.
I challenge you, Data Scientists, to think about the people in your dataset, and to take steps necessary to make the systems you design as unbiased and fair as possible. I challenge you to remain the human in the loop.
The links throughout the article provide examples and references related to what is being discussed in each section. I encourage you to go back and click on them. Below are additional links with information that can help you identify and reduce biases in your analyses and models.
The GigaOm article “Careful: Your big data analytics may be polluted by data scientist bias” discusses some “bias-quelling tactics”
“Data Science: What You Already Know Can Hurt You” suggests solutions for avoiding “The Einstellung Effect”
Part I of the book Applied Predictive Modeling includes discussions of the modeling process and explains how each type of data manipluation during pre-processing can affect model outcome
This paper from the NIH outlines some biases that occur during clinical research and how to avoid them: “Identifying and Avoiding Bias in Research”
The study “Bias arising from missing data in predictive models” uses Monte Carlo simulation to determine how different methods of handling missing data affect odds-ratio estimates and model performance
Use these wikipedia articles to learn about Accuracy and Precision and Precision and Recall
A study in Clinical Chemistry examines “Bias in Sensitivity and Specificity Caused by Data-Driven Selection of Optimal Cutoff Values: Mechanisms, Magnitude, and Solutions”
More resources from a workshop on fairness, accountability, and transparency in machine learning
Edit: After listening to the SciFri episode I linked to in the comments, I found this paper “Certifying and removing disparate impact” about identifying and reducing bias in machine learning algorithms.
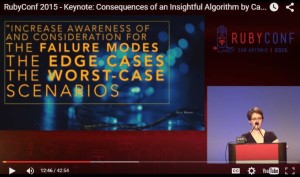
Edit 11/23: Carina Zona suggested that her talk “Consequences of an Insightful Algorithm” might be a good reference to include here. I agree!
(P.S. Sometimes the problem with turning a decision over to machines is that the machines can’t discriminate enough!)
Do you have a story related to data science and bias? Do you have additional links that would help us learn more? Please share in the comments!
]]>