I had a few frustrations with it because the documentation isn’t great, and also sometimes it would silently timeout and it wasn’t clear why nothing was running, but if I stopped all of the services, closed, restarted DataLab, and reopened, everything would work fine again. It’s clearly in Beta, but I had fun learning how to get it up and running, and it was cool to be able to write SQL in a Jupyter notebook.
I tried to connect to my Google Analytics account, but apparently you need a paid Pro account to do that, so I just connected to one of the built-in public datasets. If you view the notebooks, you will see I clearly wasn’t trying to do any in-depth analysis. I was just playing around and getting the queries, dataframes, and charts to work.
I hadn’t planned to get into too many details here, but wanted to share the results. I did jot down notes for myself as I set it up, which I’ll link to below, and you can see the two notebooks I made as I explored DataLab.
Exploring BigQuery and Google Charts
Version Using Pandas and Matplotlib
(These aren’t tidied up to look professional – please forgive any typos or messy approaches!)
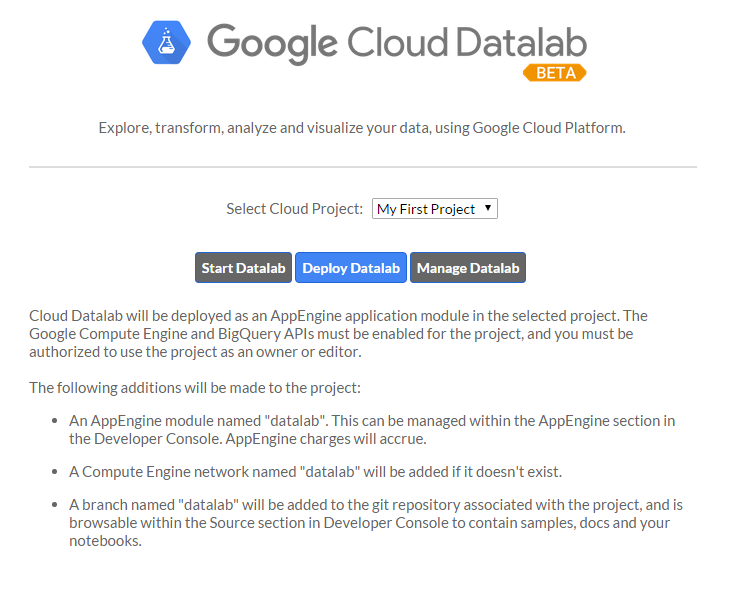
Google Cloud Datalab Setup Notes (These are notes I jotted down for myself as I went through the setup steps. Sorry if they’re not intelligible!)
]]>select fiscal_year, donorid,
(case when DonorID IN (select donorid from Donations d1 where d1.fiscal_year = d.FISCAL_YEAR - 1 and HardCredit > 0) then 'Retained'
when DonorID IN (select donorid from Donations d2 where d2.fiscal_year >= d.FISCAL_YEAR - 5 and d2.FISCAL_YEAR <= d.fiscal_year - 2 and HardCredit > 0) then 'Reactivated 2-5'
when DonorID IN (select donorid from Donations d3 where HardCredit > 0 and d3.FISCAL_YEAR < d.FISCAL_YEAR - 5 ) then 'Reactivated Lapsed'
else 'Acquired Donor'
end) FY_DonorType
from Donations d
where Donor_Record_Type = 'A' and HardCredit > 0
group by fiscal_year, donorid, (case when DonorID IN (select donorid from Donations d1 where d1.fiscal_year = d.FISCAL_YEAR - 1 and HardCredit > 0) then 'Retained'
when DonorID IN (select donorid from Donations d2 where d2.fiscal_year >= d.FISCAL_YEAR - 5 and d2.FISCAL_YEAR <= d.fiscal_year - 2 and HardCredit > 0) then 'Reactivated 2-5'
when DonorID IN (select donorid from Donations d3 where HardCredit > 0 and d3.FISCAL_YEAR < d.FISCAL_YEAR - 5 ) then 'Reactivated Lapsed'
else 'Acquired Donor'
end)
;
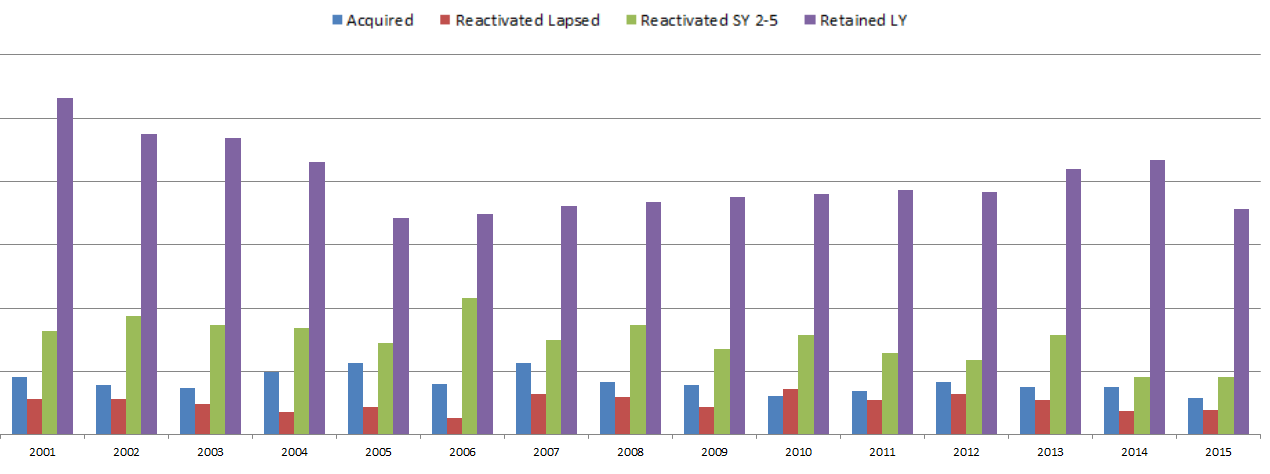
So in the Donations table, there is one row per donor per gift. There can be multiple gifts in a fiscal year, but as soon as the first gift is made, the donor can then be given a FY_DonorType using a CASE statement. If the donor also gave last year, then the donor is “Retained”. If they have given in the past, they’re “Reactivated”. I separated out those reactivated in the last 2-5 years and those that hadn’t given for longer, since once a donor had not given for 5 years, they are considered “Long Lapsed” and much harder to reactivate. If the donor had never appeared in the table before, he or she is a New donor and marked as “Acquired”. We are not looking at how many people gave last year but not this year (“Lost”), but only the breakdown of who this year’s donors are.
Since the code groups by fiscal year and donor ID, and the case statements include selects that look at previous years relative to each gift’s fiscal year, you can look at how the “current year” donors break down every year. Each year is relative to the previous years.
This allows us to make visualizations that give some insight into how the fundraising team performed each year. Some years, the fundraising organization was particularly good at reactivating lost donors. Some years they retained donors from the previous fiscal year at a high rate, but the ones that hadn’t given for more than a year must not have been targeted well and fell off more than usual. This is likely a result of how often they solicited each group, and what type of solicitations were used. (I purposely hid the Y-axis and other info since I’m using this for illustrative purposes and not trying to give away details related to the fundraiser.)
What database tables do you have that could be analyzed in this way?
]]>