Week 1 was all about brainstorming ideas and gathering resources – dreaming up what you’d love to learn, and finding content that will help you learn it.
Week 2 (which started yesterday, but don’t worry, jump in any time even if you see this blog post a month from now) is all about goal-setting.
You should set a #SoDS18 goal that’s lofty enough to excite and motivate you, but not so out of reach that you’ll never complete it and only get disheartened when halfway through the summer you realize you are only 10% of the way there.
Make sure to keep goals attainable! Last year my goals were too expansive and by week 4 there was zero chance of accomplishing all of them which was super demotivating https://t.co/uXiwUFNYU5
— Nick Heitzman
(@NickDoesData) May 28, 2018

I also want to make sure you know what makes a good goal. I like the definition used by the SMART approach:
Your goal should be
- Specific
- Measurable
- Achievable
- Relevant
- Time-Bound
Instead of explaining each of these in detail (you can read more about it elsewhere on the internet), I’m going to give an example of things you can jot down for yourself for each of these, then an example summary tweet for 2 different #SoDS18 goals.
Let’s say the idea you had for what to learn this summer is “Start learning Python”, and the resource you found is DataQuest. Let’s turn that into a SMART goal:
Specific – Learn how to import, clean, and visualize data using python and pandas
Measurable – Complete all courses in the DatQuest Data Scientist Path
Achievable – I can spend at least 6 hours on this project every weekend, plus occasional weekday evenings, so I have enough time available to do the work [Note from Renee: I have not actually researched how long this course series would take to complete]. I have joined the #py4ds Slack community and will ask for help there and on DataQuest if I get stuck so I don’t get set far behind.
Relevant – I want to add python and pandas to my resume, and it’s my first step on my new path to becoming a data scientist, so it’s relevant to my career goals and I’m motivated to accomplish it.
Time-Bound – the Summer of Data Science ends on September 3, so I will finish this first goal by August 3 in order to have time to complete a small project during the last month of #SoDS18.
Example tweet to share this goal with the world:
My 1st#SoDS18 goal: I will learn to import, clean, and visualize data with python & pandas by spending 6-8 hours per week on the Data Scientist Path on DataQuest, and will complete it by August 3. I’ll ask in #py4ds Slack if I need help.
Or, if your idea is to “do a machine learning project using at least 2 different algorithms on some kind of dataset that could help people”. That can be converted to a SMART goal like:
Specific – Learn how to use random forest and logistic regression in R by experimenting with data from the Kaggle DonorsChoose.org Dataset to develop a list of donors to email about a particular type of project request
Measurable – I will complete exploratory data analysis on the available DonorsChoose data files and write a blog post about my findings that includes at least 3 visualizations. Then I will find out what it means to submit a Kaggle Kernel, build 2 machine learning models using random forest and logistic regression algorithms and compare their model evaluation metrics to each other, submit the Kernel (even if the contest period is over), and find and study at least 2 other people’s submissions to understand different approaches to the problem. Then I will write another blog post summarizing my results and findings.
Achievable – I have read about random forest and logistic regression online, and my friend gave me the Introduction to Statistical Learning book so I can better understand these machine learning algorithms. I have a bunch of resources bookmarked online in case I need extra references to understand the book. I will tweet using the #rstats hashtag or talk to my friend if I need help. If I find out the dataset I found isn’t great for learning these 2 algorithms, I will search for another dataset as needed. I can dedicate 2 hours a day 4 days per week to working on the project and researching these topics.
Relevant – I started learning R over the last year and have used it to complete labs at school, but want to expand my machine learning capabilities and apply my skills to a real-world dataset before I start applying for jobs in the fall.
Time-Bound – I have 12 weeks to complete the project this summer.
Example tweet
My #SoDS18 goals are to:
-explore the DonorsChoose Kaggle dataset
-use ISL book & online resources to learn to build random forest and logistic regression models
-create and submit a Kaggle Kernel to help DonorsChoose
-write at least 2 blog posts about it over the next 12 weeks
I think you get the idea!
I should also mention that you don’t want to over-plan. Notice the note about switching datasets if one doesn’t work out – plan to be flexible! You don’t yet know what you’re getting into, and you might need to find more time finding good resources to learn, getting help, or pivoting if your original plan doesn’t work out. That’s OK! Just go with the flow and try to achieve something comparable to your initial goal. But, you need an initial goal in order to figure out where you are relative to it!
So, finish brainstorming your learning ideas and finding resources this week, then narrow it down to a SMART goal, and tweet about it with the #SoDS18 hashtag so we know what you plan to learn during the Summer of Data Science 2018!
And if you’re still looking for project ideas, check out Mara Averick’s post, browse the #SoDS18 hashtag, or join a data science learning community! (More about this in another blog post later this week!)
]]>
But I’m sure the main thing you’re here to find out is how to get involved yourself! So, here are the basics:
How to participate in the Summer of Data Science:
- Pick a thing or a short list of things related to data science that you want to learn more about this summer (or this winter if you’re in the southern hemisphere!)
- Make a plan to learn it (like an online course, a practice project, etc.).
- Share that plan on social media, then post updates as you make progress, with the hashtag #SoDS18.
Here’s a twitter moment with a bunch of entries from #SoDS17 for reference!
We’ll run this one from today – May 28, 2018 – through Labor Day in the U.S. – September 3, 2018. What you can realistically get done in that time depends on where you are in your data science learning journey, what your work schedule and family obligations are like, and many other factors – so think about what’s realistic for you to accomplish during this time.
Week 1 will be about brainstorming and researching possibilities and resources for summer projects, courses, etc. And in Week 2 we’ll set specific goals for the rest of the summer. So, start thinking of ideas now!
If you would like some ideas for beginners, here’s a list of beginner content on my site DataSciGuide:
Recommended Resources for Beginners
You might want to pick a book or course and go through it, trying out the exercises this summer.
I also have a Flipboard where I have collected a bunch of Data Science Tutorials you might want to check out (note: these aren’t all aimed at beginners).
There are also a whole bunch of online communities where you can join others in a project, or ask questions if you get stuck on yours. I’ll be writing another post highlighting those this week!
Follow me on twitter @becomingdatasci, and tweet with the hashtag #SoDS18 when you post updates about your progress! (It’s a good idea to “thread” your tweets throughout the summer, or add them to a Twitter Moment, so others can easily follow along!)
I’ll be retweeting a bunch of people’s ideas and resources, so keep an eye out there for more ideas if you aren’t sure where to start!
]]>The Summer of Data Science is a commitment to learn something this summer to enhance your data science skills, and to share what you learned. (Those of you in the Southern Hemisphere will have to pick up the excitement when we’re winding down during our fall/your spring and keep it going! Or, join us during your Winter of Data Science!)
For those of you who haven’t been following me for years, a hashtag I started back in 2015, #SoDS, is actually one of the things that started growing my twitter following. Here’s the history:
1st month of tweets, May 2015 Storified
Unfortunately, I didn’t keep up the ‘Storification’ after that, but you get the idea. It brought a bunch of us together to share our learning progress. We learned from each other, encouraged each other, and most of all geeked out about data science together!
I didn’t launch one last year, because I was starting a new job and taking a break from recording the podcast, and just didn’t want to take on too much. But I missed it, so I didn’t want to let another year pass without a Summer of Data Science, so we’re going to do it together again this year!
So, here are the only “rules”:
How to participate in the Summer of Data Science:
- Pick a thing or a short list of things related to data science that you want to learn more about this summer.
- Make a plan to learn it (like an online course, a practice project, etc.).
- Share that plan on social media, then post updates as you make progress, with the hashtag #SoDS17.
That’s it! (And yes, there’s a chef competition that used the same hashtag. No worries! Enjoy the food pics.)
If you’re looking for ideas for learning projects or topics, check out the Data Science Learning Club! Please write about your learning experiences and share in the Data Science Learning Club #SoDS forum, and/or on your own blog, and share on social media. I’ll check out the hashtag on twitter regularly and RT others. I’ll be participating myself, too!
Here’s a link to the hashtag on twitter: #SoDS17. See you there!
P.S. Did you know that there is a “Summer of Data Sci” song? :D
P.P.S. There are now Summer of Data Science 2017 t-shirts and tanks in the Becoming a Data Scientist teespring shop!
UPDATE: Here is a twitter Moment with a selection of tweets from the #SoDS17 participants this year! (It starts out with a bunch of intro tweets from me, but click through to twitter and keep scrolling!)
Summer of Data Science 2017
Verena, David, Kerry, and Anthony are members of the Becoming a Data Scientist Podcast Data Science Learning Club! They appear in the order in which they joined the club, and each discuss their starting points before joining, their participation in the activities, and advice they have for new data science learners. Podcast Audio Links: Link to podcast Episode 12 audio Podcast's RSS feed for podcast subscription apps Podcast on Stitcher Podcast on iTunes Podcast Video Playlist: Youtube playlist of interview videos More about the Data Science Learning Club: Data Science Learning Club Welcome Message]]>
Verena, David, Kerry, and Anthony are members of the Becoming a Data Scientist Podcast Data Science Learning Club! They appear in the order in which they joined the club, and each discuss their starting points before joining, their participation in the activities, and advice they have for new data science learners.
Podcast Audio Links:
Link to podcast Episode 12 audio
Podcast’s RSS feed for podcast subscription apps
Podcast on Stitcher
Podcast on iTunes
Podcast Video Playlist:
Youtube playlist of interview videos
More about the Data Science Learning Club:
Data Science Learning Club Welcome Message
Data Science Learning Club Meet & Greet
1) Verena Haunschmid
Data Science Learning Club Activity 07: Linear Regression
Verena’s Results for Linear Regression on Salary Dataset


Verena’s website
@ExpectAPatronum on Twitter
2) David Asboth
City University London Msc Data Science
Data Science Learning Club Activity 02: Creating Visuals for Exploratory Data Analysis
David’s results exploring London Underground data
Data Science Learning Club Activity 07: K-Means Clustering
David’s results using k-means to draw puppies in 3 colors
FlyLady (the house cleaning system I mentioned)
David’s website
@davidasboth on Twitter
3) Kerry Benjamin
Data Science Learning Club Activity 01: Find, Import, and Explore a Dataset
Kerry’s results for Activity 1 IGN Game Review Data exploration
Data Science Learning Club Activity 02: Creating Visuals for Exploratory Data Analysis
Kerry’s Blog Post about Activity 02 – “My First Data Set Part 2: The Fun Stuff”
Blog post about Data Camp – “The Data Science Journey Begins”
Kerry’s blog post “Getting Started in Data Science: A Beginner’s Perspective”
Kerry’s Blog “The Data Logs”
@kerry_benjamin1 on Twitter
4) Anthony Peña
molecular biology
biotechnology
Data Science Learning Club Activity 07: K-Means Clustering
Anthony’s results for Activity 07
I had an idea today that would take it a step further. Imagine how book clubs work where you pick a book, go off and read it, then gather occasionally to discuss and record your thoughts. Except instead of a book club, it’s a data science learning club!
I’m imagining picking a topic/project, finding resources showing how to do it, and introducing it to the club at the end of a podcast episode. Then, everyone that wants to participate in learning how to do that particular thing will go off for maybe 2 weeks, work on it and learn what they can, ask questions to each other in a common area like a blog post comment thread, create things and post them to a shared space, then at the end of the period post comments about what they learned and how it went. People could write blog posts about their projects and I would collect those and link to all of them from the original post. Anyone that already knows how to do it could help answer questions if they wanted to participate, too. I might invite some of the participants to talk about their learning experience on a follow-up episode, then the notes and results would be posted for future learners to find.
I think learning together would be fun and valuable, and this type of experience would fall somewhere between learning on your own and taking a class. It would include the pros of learning on your own and exploring, while offsetting some of the cons of going at it alone. It would be a significant time commitment on my part, so I want to make sure other people would join in before I commit. What do you think? Would you join a “data science learning club” and participate in something like this and find it valuable? It’s kind of like the Summer of Data Science, but we’d be learning the same things simultaneously and sharing our results. No one would be “teaching” the group necessarily, but we’d share resources and answer each other’s questions based on what we did individually.
Let me know in the comments or on twitter if you would find this valuable and if you want me to lead it!
]]>Thanks to Orlando and Herbierto for having me on!
(P.S. I did put up the post about Data Sources on DataSciGuide)
]]>[Spoiler Alerts – but you probably already know much of the story, and the movie is still good even if you know the historical outcome.]
I thought a moment like this may be coming when Alan Turing was first applying to work at Bletchley Park, and Denniston can’t believe he’s applying to be a Nazi codebreaker without even knowing how to speak German. Alan emphasizes that he is masterful at games and solving puzzles, and that the Nazi Enigma machine is a puzzle he wants to solve. He starts designing and building a machine that will theoretically be able to decode the Nazi radio transmissions, but the decoder settings change every day at 12am, so the machine must solve for the settings before the stroke of midnight every day in order for the day’s messages to be decoded in time to be useful and not interfere with the next day’s decoding process. Turing can’t prove his machine will work, simply because it is simply taking too long to solve the daily puzzle. In the meantime, people are dying in the war, and the Nazis are going on transmitting their messages over normal radio waves believing the code is “unbreakable”.
[More specific plot spoiler in the 2 paragraphs below]
The moment I’m referring to is when Alan hears a woman explaining that the German man whose messages she is assigned to translate always starts his messages off with “Cilla”, who she assumes is the transmitter’s girlfriend. This triggers Alan to realize there could be repeated messages that would drastically narrow down the number of decryption keys because you could specify that there was always a word or phrase that could be expected in the messages. They realized that there was a 6am weather report transmitted daily, and that every message ended in “Heil Hitler”, so they set the machine so it could focus its search on finding the words “weather”, “heil”, and “Hitler” in the 6am message every day. This solved the puzzle, as the machine was then able to quickly decode the messages from a narrower set of possible solutions instead of running all day without finding one.
So, Alan Turing (at least in the movie version) had been focusing on a random set of hundreds of millions of possible solutions, which his machine could solve faster than humans, and trying to tune the design of his machine to find the solution faster. The hint that ended up leading to the solution involved bringing the human thought process back into it – if there was something the messages said frequently, because they were written by humans, and humans follow certain communication and linguistic patterns, that could be exploited to narrow down the range of solutions.
[/end specific plot spoiler]
This got me thinking about machine learning and data science in general. A frequent Kaggle competition winning strategy is to quickly iterate through a multitude of algorithms and optimize for the evaluation metric, or focus on stacking thousands of models. [Here are several interviews with Kaggle winners.] Some of the winners do mention needing to study up on the field to gain some domain expertise, and the Quora answer here focuses on data understanding a preparation, but many teams appear to take a brute-force-type approach to building their models and writing programs to iterate through each combination of algorithms to maximize the area under the curve or whatever measure that particular competition is scored on.
I don’t want to do that type of brute-force data science. I’ll leave that up to the competitive types that enjoy quickly iterating through as many solutions as possible, and building systems to help them do this faster, and have a focus on winning vs understanding. Of course there is a place for that type of approach, and it is very valuable in solving some problems, but it’s not attractive to me. It’s too robotic.
However, there are many areas (like my day-job, university/non-profit fundraising), where knowing your specific community, what types of data you’re collecting, where it’s from, how trustworthy it is, will have a large impact on what fields you decide to include in your model and of course how you interpret the output. These are areas where we’re talking about data with a lot of variety, but not necessarily a lot of volume (at least not on the scale of something like credit card processing and fraud detection), and where I would think domain expertise is more valuable than fast model optimization. It is also vital to be able to explain how to be able to use the output of a given model. It is more of a consulting role than a mathematical/programming one.
I think that’s where I’m headed in my data science learning. I am aiming to learn how to use models to inform decision-making, how to choose the best data to put into a model, how to choose which type of model to use, and how to watch out for things like covariance and other confounding effects. Then, when you get a result, how to know whether to trust the result, how to explain it to non-technical managers, and how to best implement what was learned in order to have a positive impact on real-world outcomes. It is more of a creative iterative cycle than a machine/optimization iterative cycle.
Like in Imitation Game, understanding human behavior and communication can be the “big hint” that informs a technical solution, and optimizes its performance beyond what a better-tuned piece of hardware or more efficient code could do. It seems to me (and I have heard others saying) that understanding people and business is more than just a piece of the “data science venn diagram”, it’s really the key to success in this field. (And also a good reason to have diverse data science teams.)
I’m curious about how those of you that work as data scientists see these various aspects of data science, and how much of your work involves creative and “human” skills vs the “hard skills” of math and computer science. I would think it varies depending on industry and the type of problem you’re trying to solve, but I am interested in your personal experience. Please comment below to share your experiences!
]]>
My main motivation is that I keep hearing people say (and sometimes feel myself) that learning to becoming a data scientist on your own using online resources is totally overwhelming: there are so many different possible topics to dive into, few really good guides, lots of impostor-syndrome-inducing posts by people you follow that make you feel like they’re so far ahead of where you are and you’ll *never* get there…. but there’s so much great data science learning content online for everyone from beginners to experienced data scientists!
We need a better way to navigate it.
Hence my new website: “Data Sci Guide”. It will eventually have a personalized recommender system and structured learning guides and all kinds of other features to help you find the resources to go from where you are to where you want to be, but for now it’s “just” a directory / content rating site. And it’s not ready for you to interact with yet, but it’s getting there, and I’ll need your help fleshing it all out soon.
So go take a look! Then come back here to give me feedback and suggestions, because you have to be registered to comment there and I didn’t turn on new user registration yet.
OK go now. Don’t forget to come back!
>>>> DATA SCI GUIDE.COM <<<
So…. what did you think? What do you think of the overall idea and plans? What should I be sure to remember to include? Tell me below!
]]>
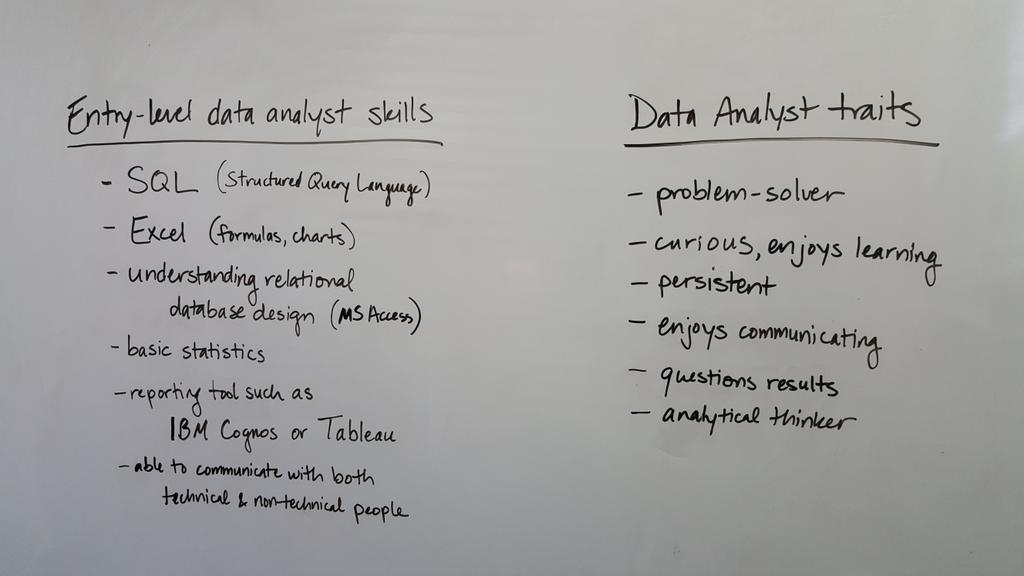
I posted this picture on Twitter:
and got some interesting responses:
@BecomingDataSci I'd include familiarity with business process in one of those columns. Can't analyze in a vacuum,.
— Karen Clark (@clarkkaren) July 17, 2015
@BecomingDataSci @aflyax You've got analytical thinking & problem solving. Maybe add "adaptable to a variety of environments" as generic?
— Karen Clark (@clarkkaren) July 20, 2015
@barbarafenton i mentioned that as a misconception! i spend a lot more time communicating than most people think
— Data Science Renee (@BecomingDataSci) July 17, 2015
@DataSkeptic yes i think that's important, but you can get an entry level job w/just basic charting skills. was trying to keep to minimum.
— Data Science Renee (@BecomingDataSci) July 17, 2015
@BecomingDataSci so e.g. "SQL" could be "data manipulation skills (e.g. SQL)" – don't get hung up on a specific tool to to the job! 2/2
— Martin Monkman (@monkmanmh) July 17, 2015
@BecomingDataSci This is great! My ready-fire-aim data science side says to add "asking forgiveness is easier than permission" to traits :P
— Shannon Quinn (@SpectralFilter) July 17, 2015
@BecomingDataSci I'd add : autodidact
— craig pfeifer (@aCraigPfeifer) July 17, 2015
What do you think?
I’ll revisit this topic later, and I’ll also post about the conference I’m attending (APRA Data Analytics Symposium) when I have a chance to summarize. For the moment, heading back to the sessions!
]]>I posted earlier about using the UsesThis API to retrieve data about what other software people that use X software also use. I thought I was going to have to code a workaround for people that didn’t have any software listed in their interviews, but when I tweeted about it, Daniel from @usesthis replied that it was actually a bug and fixed it immediately! It makes it even more fun to develop since he is excited about me using his API!
@BecomingDataSci: YES! It’s *awesome*.
— The Setup (@usesthis) June 19, 2015
After seeing those results, I thought it would be interesting (and educational) to learn how to do a Market Basket Analysis on the software data. Market Basket Analysis is a data mining technique where you can find out what items are usually found in combination, such as groceries people typically buy together. For instance, do people often buy cereal and milk together? If you buy taco shells and ground beef, are you likely to also buy shredded cheese? This type of analysis allows brick and mortar retailers to decide how to position items in a store. Maybe they will put items regularly purchased together closer together to make the trip more convenient. Maybe they will place coupons or advertisements for shredded cheese next to the taco shells. Or maybe they will place the items further apart so you have to pass more goods on the way from one item to the other and are more likely to pick up something you otherwise wouldn’t have. Online retailers can use this type of analysis to recommend products to increase the size of your purchase. “Other customers that added item X to their shopping cart also purchased items Y and Z.”
Because I had this interesting set of software usage from The Setup’s interviews, I wanted to analyze what products frequently go together. I searched Google for ‘Market Basket Analysis python,’ and it led me to this tweet by @clayheaton:
I just wrote a simple Market Basket analysis module for Python. #analytics https://t.co/aVf58zcHJa
— Clay Heaton (@clayheaton) April 4, 2014
I followed that link and checked out the code on github and it seemed to make sense, so I put the results of my usesthis API request into a format it could use. I did a test with the data from 5 interviews, and it ran. Then I tried 50 interviews, and the results showed that people that use Photoshop were likely to also use Illustrator, and vice-versa. It appeared to be working!
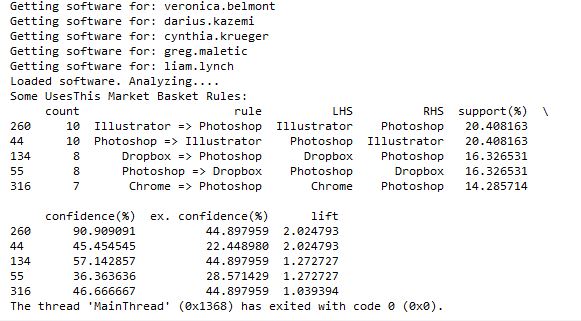
However, I then hit a snag. I tried to run it with all of the software data, and it ran for a long time then crashed when my computer ran out of memory. Since it’s building an association graph with an edge for every rule (combination of software used), with up to two pieces of software per “side” of the rule (such as “people that have Photoshop and Illustrator also have a Mac”), you can imagine the graph gets pretty big when you have over 10,000 user-software combinations.
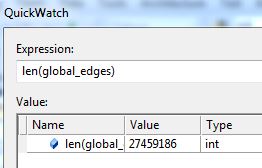
I tweeted about this and Clay suggested modifying his code to store the items in a sparse matrix instead of a graph, and I agree that that sounds like a good approach, so that’s my next step on this project. I’ll post again when I’m done!
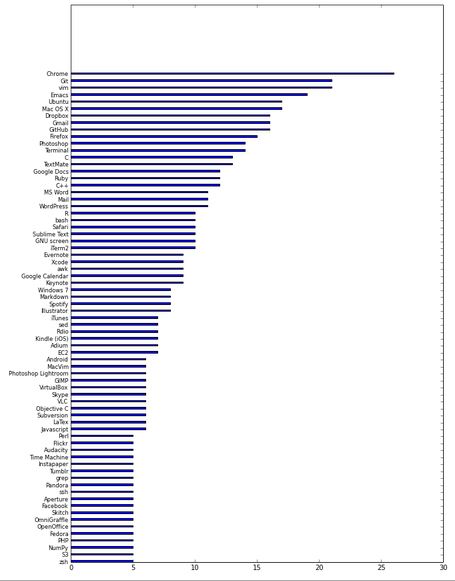
]]>Basically what I did is use the list API to return all of the interviews of people that use Python, then used the interviews API to return each of those people’s lists of gear. That way, i could tally up the most-frequently-used software (other than Python) used by the interviewed Python users!
Here’s my code in HTML IPython notebook form. I haven’t had a chance to practice visualizations yet, so please point me to any resources that will help me make the horizontal bar chart prettier!
UsesThis API – Software that Python users use
Preview of the ugly chart:
Update 6/18/15:
What about other software? I added an input so the user can type in any software title. For the output saved below, I typed in “Android” at the prompt.
Here it is on nbviewer. You can use the download button in the upper right corner to download it and run it on your local IPython installation to try it out yourself!
http://nbviewer.ipython.org/gist/paix120/78985108a55a9b32ff8c
@matt_slotnick @dpatil haha i've said b4 that O'Jays "for the love of money" but w/"data data data…DATA" runs thru my head b4 projects :)
— Data Science Renee (@BecomingDataSci) May 14, 2015
@BecomingDataSci @lukedones @matt_slotnick possible theme song, alter @bryanadams "Summer of 69" to "Summer of Data Science"
— Ryan Swanstrom (@ryanswanstrom) May 27, 2015
@ryanswanstrom @becomingdatasci @matt_slotnick '69' -> "datasci"
— lukemeister (@lukedones) May 27, 2015
So here goes….
To the tune of…
I took my first course in machine learning
Found it all for free online
Coded ’til my fingers bled
Was the Summer of Data Sci
Got together and we tried real hard
To understand how data covaried
(linear dependence between two vars)
That summer was the best endeavor
And if I had the choice
I wouldn’t change it whatsoever
Those were the best days of my life
When you got learning to do
Spent my evenings staring at my laptop
And that’s when I downloaded you
I thought that you would last forever
And then I faced a choice
I had to port you now or never
Python 2.7 to 3.5
Back in the Summer of Data Sci
Ohhh
Which were RESTful and RESTless
The response was undefined…
I guess nothin’ can work forever, 410, gone
Look at everything that’s come and gone
Sometimes I import that old library
Documented it in IPython
Analyzed my datasets on weather
Your model helped me understand
Bayesian time series forecasts better
Those were the best days of my life
Back in the Summer of Data Sci
Uh-huh
It was the Summer of Data Sci, oh yeah
Me and my Summer of Data Sci, oh
and…
To the tune of…
Data, data, data, data. DATA. [6x]
Some people got to have it
Some people really need it
Listen to me y’all, make things
make things, make things rad things with it
You wanna do things, do things
Do things, good things with it
Talk about raw data, data
Talk about raw data
Data files, y’all, c’mon now
People will knowledge-discover
For the love of data
People will track their own numbers
For the love of data
People can’t even press delete
Because they never know
which algorithm just might need it
For that clean, learned-by-machine, forecasting
almighty model
(cross-validated)
People will train decision trees
For the love of data
People develop their own techniques
For the love of data
A woman will sell her precious time
Call it clean, learned-by-machine, forecasting
almighty model
(talk about talk about stats)
Internet of Things, some evil
Give me a sample, brother can you data mine?
Data can drive some people out of their minds
Data data data no good no good don’t sell your soul for data
Data data data AI AI deep learning will
Internet of Things, some evil
Give me a sample, brother can you data mine?
Data can drive some people out of their minds
Got to have it, I really need it
Data data data
Give it up, give it up, give it up, yeah.
Data data data
Gotta have it
Some people really need it
Give me give me give me raw data
Data data data I need I need
Give me give me give me
Don’t let don’t let don’t let data rule ya
How many neighbors optimize this k
Don’t let don’t let don’t let don’t let data fool ya
yeah yeah yeah
Got to train it, then really test it
Let the feeds stream stream stream stream stream.
almighty model
I’m tellin’ y’all
Then, I tweeted about my experience, and got 2 responses encouraging me to use the requests library instead of urllib that codecademy used.
@BecomingDataSci the urllib api is terrible. You should take a look at http://t.co/CzIPob2tBV
— Daniel Moisset (@dmoisset) June 1, 2015
@dmoisset @BecomingDataSci 2nding using of requests over urllib; esp. with HTTPS, requests tends to do saner things (e.g., cert validation)
— Cheng H. Lee (@chenghlee) June 1, 2015
I decided to redo what I had learned from scratch, but using requests. I also wanted to learn how to use IPython, so I used an IPython notebook to play around with the code. Below is the HTML export of my IPython notebook, with comments explaining what I was doing. I’m sure there are better ways to do what I did (feel free to comment with suggestions!), but this was my first time doing any of this without any guidance, so I don’t mind posting it even if it’s a little ugly :) I definitely spent a lot of time understanding the hierarchy of the NPR XML and how to loop through it and display it. If you have done something similar in a more elegant way, please point me to your code!
Here are the main resources I used to learn how to do what is in the code:
- python requests library documentation
- NPR API documentation
- python lxml library documentation
- iPython videos
I also wanted to mention that there are a lot of frustrations you can run up against when you’re a python beginner. I was having a lot of problems with seemingly basic stuff (like installing packages with pip) and it took a couple hours of googling and asking someone for help to figure out there was a problem with my path environment variables in windows. I’ll post about that another time, but I just wanted to 1) encourage people not to give up if you get stuck on something that seems to be so basic that most “intro” articles don’t even cover it, and 2) encourage people writing intro articles to make some suggestions about what could go wrong and how to problem-solve.
Here’s one example: When I tried to export my IPython notebook to HTML, it gave me a 500 server error saying I needed python packages I didn’t already have. After I installed the first, it told me I needed pandoc, so I installed that as well, but it kept giving me the same error. It turns out that you have to run IPython Notebook as an Administrator in Windows in order to get the HTML export to work properly, but the error message didn’t indicate that at all. This is the kind of frustration that may make beginners think they’re not “getting it” and give up, when it fact it’s something outside the scope of what you’re learning. Python seems to require a lot of this sort of problem-solving.
(Note: on my other laptop, I installed python and the scipy stack using Anaconda, and have had a lot fewer issues like this.)
Without further ado, here’s my iPython notebook! (I’m having issues making it look readable while embedded in wordpress, so click the link to view in a new tab for now, and I’ll fix for viewing later!)
Renee’s 1st IPython Notebook (NPR API using requests and lxml)
Here’s the actual ipynb file if you have IPython installed and want to run it yourself: First Python API Usage**
**NOTE: WordPress wouldn’t let me upload it with the IPython notebook extension for security reasons, so after you download it, change the “.txt” extension to “.ipynb”!
I had a thought while daydreaming, and tweeted this, thinking a few people might think it was fun and respond:
I'm planning to do a lot of data science learning this summer. Anyone else? Maybe we shld start a hashtag #SoDS "Summer of Data Science" :)
— Data Science Renee (@BecomingDataSci) May 14, 2015
…and as you can see by the RT and Favorite count, it kind of took on a life of its own!
I thought of a variation
…or maybe more fun #SODAS "Summer of Data Science". like a cool, refreshing beverage. & we'll hand off to So Hemisphere ppl in the fall :)
— Data Science Renee (@BecomingDataSci) May 14, 2015
and so did some other people
@BecomingDataSci It could be #SoDaS (just add the little "a" in there for D"a"ta…)
— Nicole Radziwill (@nicoleradziwill) May 14, 2015
@BecomingDataSci #DSS15 Data Science Summer 2015
— BigMikeInAustin (@BigMikeInAustin) May 14, 2015
In the end, it looks like #SoDS won…. and got a whole lot of support because of a RT by @dpatil! Thanks to him, this is what my notifications started to look like:
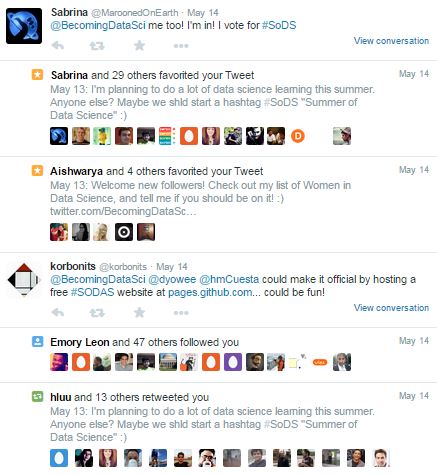
Too bad I was supposed to be working on writing up something for work…. that didn’t get done that night! I came back later and was really surprised by the response!
I was excited by all of the new followers, and especially happy that some people appeared to have been inspired by the hashtag to do some data science learning of their own!
@BecomingDataSci @seinecle and is there something like "data science for über-beginners"? =D
— Lexane Sirac (@lexanesirac) May 14, 2015
2 minutes later…
@BecomingDataSci @seinecle @clarecorthell thank you so much! I'll make sure to take part in #SoDS then!
— Lexane Sirac (@lexanesirac) May 14, 2015
So it seems I started something and now I need to follow up! I’m going to tag my summer learning projects on here with the “#SoDS 2015” post category, and tweet about them (of course!) using the #SoDS hashtag on twitter. Will you join me? :)
Here’s to an awesome Summer of Data Science! Now I’m going to try to go respond to all of your tweets!
(P.S. the hashtag just started being used by some Dutch foodies, but we’ll overwhelm that version with our data science tweets pretty soon!)
P.P.S. we even have a unicorn joining us this summer!
@BecomingDataSci @DataSkeptic count me in! #SoDS #becomingaunicorn
— Data Science Unicorn (@DataScienceUni) May 14, 2015
]]>