I said I’d share my slides on my “SQL for Data Science” talk, so here they are!
I only had 40 minutes, so this wasn’t a full tutorial, and I couldn’t really teach many different concepts, but my main goal was to point out a bunch of different stuff you could do with SQL, and how to think about creating an analytical dataset, so attendees would be aware of what was possible and what they should look up if they wanted to start learning about SQL.
Enjoy!
]]>Recorded at Tom Tom Fest Applied Machine Learning Conference in Charlottesville, VA on April 11, 2019.
Episode 17 Audio
@therriaultphd on twitter
Data and Democracy
This O’Reilly ebook by Andrew Therriault explores how political data science helps to drive everything from overall strategy and messaging to individual voter contacts and advertising.
Data Security for Data Scientists by Andrew Therriault on Medium
Ten practical tips for protecting your data (and more importantly, everyone else’s!)
World premiere
— Data Science Connect (@DataScienceATL) April 11, 2019
]]>Our first ever live audience for Becoming a Data Scientist podcast at #AMLCville! With @therriaultphd! pic.twitter.com/JA1RpiKq0u
— Data Science Renee (@BecomingDataSci) April 11, 2019
Here is the link to the previous post, which has a pdf version of the slides that’s almost identical, and a video from when I gave this talk at Tom Tom Fest Applied Machine Learning Conference in 2018.
Here’s the blog post that was the start of researching this topic, for me.
Here’s the twitter list of people who talk about Ethics & Law in AI/ML.
And here’s the flipboard magazine where I collect articles on this topic.
Enjoy!
]]>This is a conference I’ve helped plan since the beginning, and it’s grown in 3 years from a single theater with a partial day of talks to 4 theaters with non-stop presentations all day, plus keynotes in an even larger venue!
An exciting announcement from me is that I will be recording a short episode of my Becoming a Data Scientist Podcast in front of a live audience for the first time at the AMLC! I’ll be interviewing Andrew Therriault, one of our keynote speakers, about how he became an Infrastructure Data Science Manager at Facebook, after starting out with degrees in politics, and working as the Director of Data Science for the Democratic National Committee, and the Chief Data Officer for the City of Boston, among other roles.
I am featuring an AMLC speaker each day with the #AMLCville hashtag on twitter. You can learn more about all of our speakers (still more to be added!) and get tickets on the conference website. Hope to see you there!
]]>I plan to come back and add more info here in the future, but for now, here is a PDF version of my slides:
My Journey from Advancement Data Analyst to Data Scientist
Week 1 was all about brainstorming ideas and gathering resources – dreaming up what you’d love to learn, and finding content that will help you learn it.
Week 2 (which started yesterday, but don’t worry, jump in any time even if you see this blog post a month from now) is all about goal-setting.
You should set a #SoDS18 goal that’s lofty enough to excite and motivate you, but not so out of reach that you’ll never complete it and only get disheartened when halfway through the summer you realize you are only 10% of the way there.
Make sure to keep goals attainable! Last year my goals were too expansive and by week 4 there was zero chance of accomplishing all of them which was super demotivating https://t.co/uXiwUFNYU5
— Nick Heitzman
(@NickDoesData) May 28, 2018

I also want to make sure you know what makes a good goal. I like the definition used by the SMART approach:
Your goal should be
- Specific
- Measurable
- Achievable
- Relevant
- Time-Bound
Instead of explaining each of these in detail (you can read more about it elsewhere on the internet), I’m going to give an example of things you can jot down for yourself for each of these, then an example summary tweet for 2 different #SoDS18 goals.
Let’s say the idea you had for what to learn this summer is “Start learning Python”, and the resource you found is DataQuest. Let’s turn that into a SMART goal:
Specific – Learn how to import, clean, and visualize data using python and pandas
Measurable – Complete all courses in the DatQuest Data Scientist Path
Achievable – I can spend at least 6 hours on this project every weekend, plus occasional weekday evenings, so I have enough time available to do the work [Note from Renee: I have not actually researched how long this course series would take to complete]. I have joined the #py4ds Slack community and will ask for help there and on DataQuest if I get stuck so I don’t get set far behind.
Relevant – I want to add python and pandas to my resume, and it’s my first step on my new path to becoming a data scientist, so it’s relevant to my career goals and I’m motivated to accomplish it.
Time-Bound – the Summer of Data Science ends on September 3, so I will finish this first goal by August 3 in order to have time to complete a small project during the last month of #SoDS18.
Example tweet to share this goal with the world:
My 1st#SoDS18 goal: I will learn to import, clean, and visualize data with python & pandas by spending 6-8 hours per week on the Data Scientist Path on DataQuest, and will complete it by August 3. I’ll ask in #py4ds Slack if I need help.
Or, if your idea is to “do a machine learning project using at least 2 different algorithms on some kind of dataset that could help people”. That can be converted to a SMART goal like:
Specific – Learn how to use random forest and logistic regression in R by experimenting with data from the Kaggle DonorsChoose.org Dataset to develop a list of donors to email about a particular type of project request
Measurable – I will complete exploratory data analysis on the available DonorsChoose data files and write a blog post about my findings that includes at least 3 visualizations. Then I will find out what it means to submit a Kaggle Kernel, build 2 machine learning models using random forest and logistic regression algorithms and compare their model evaluation metrics to each other, submit the Kernel (even if the contest period is over), and find and study at least 2 other people’s submissions to understand different approaches to the problem. Then I will write another blog post summarizing my results and findings.
Achievable – I have read about random forest and logistic regression online, and my friend gave me the Introduction to Statistical Learning book so I can better understand these machine learning algorithms. I have a bunch of resources bookmarked online in case I need extra references to understand the book. I will tweet using the #rstats hashtag or talk to my friend if I need help. If I find out the dataset I found isn’t great for learning these 2 algorithms, I will search for another dataset as needed. I can dedicate 2 hours a day 4 days per week to working on the project and researching these topics.
Relevant – I started learning R over the last year and have used it to complete labs at school, but want to expand my machine learning capabilities and apply my skills to a real-world dataset before I start applying for jobs in the fall.
Time-Bound – I have 12 weeks to complete the project this summer.
Example tweet
My #SoDS18 goals are to:
-explore the DonorsChoose Kaggle dataset
-use ISL book & online resources to learn to build random forest and logistic regression models
-create and submit a Kaggle Kernel to help DonorsChoose
-write at least 2 blog posts about it over the next 12 weeks
I think you get the idea!
I should also mention that you don’t want to over-plan. Notice the note about switching datasets if one doesn’t work out – plan to be flexible! You don’t yet know what you’re getting into, and you might need to find more time finding good resources to learn, getting help, or pivoting if your original plan doesn’t work out. That’s OK! Just go with the flow and try to achieve something comparable to your initial goal. But, you need an initial goal in order to figure out where you are relative to it!
So, finish brainstorming your learning ideas and finding resources this week, then narrow it down to a SMART goal, and tweet about it with the #SoDS18 hashtag so we know what you plan to learn during the Summer of Data Science 2018!
And if you’re still looking for project ideas, check out Mara Averick’s post, browse the #SoDS18 hashtag, or join a data science learning community! (More about this in another blog post later this week!)
]]>
First, I’d like to thank our awesome judges, who went through 2 difficult rounds of judging and discussion to help select the winners!
“Judging this was so difficult. I was blown away by the creativity.“ – Karen Lopez“Every single entry was compelling.” – Natasha
As described in the original post, we had 3 categories to be won, which can be summarized as follows:
- Most Beautiful – depicted the original visualization’s data in a visually impressive way
- Most Informational – most effectively/readably communicates the data from the original visualization
- Most Fun! – made the judges smile
There was no category where there was a clear winning crafty data visualization. Everyone who entered put their heart into it and had some creative, beautiful, fun, and informative handmade art! Without further ado, here are the top selections:
Most Beautiful
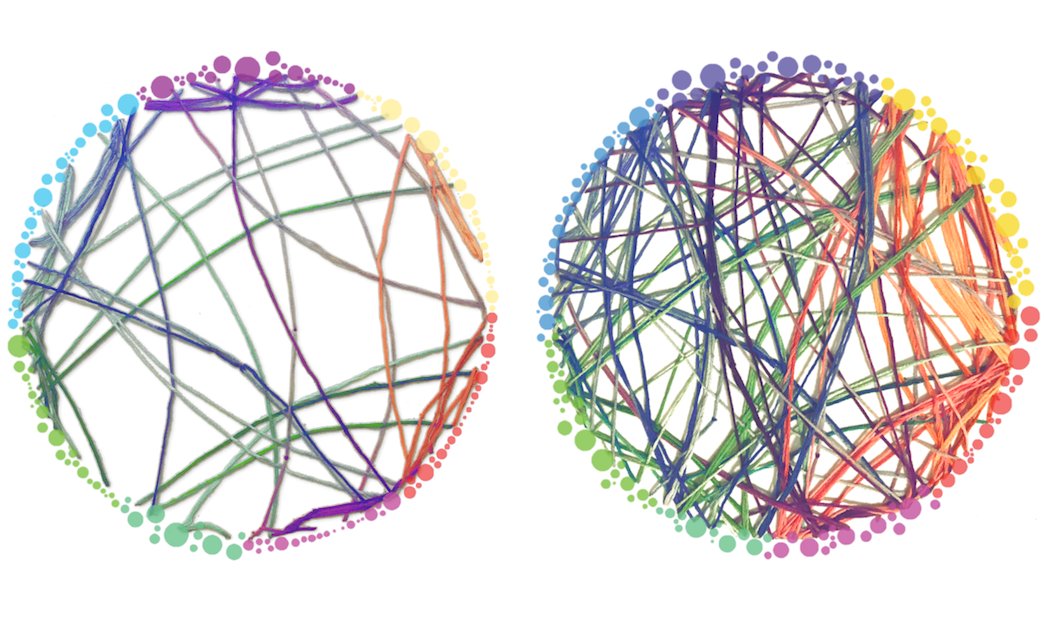
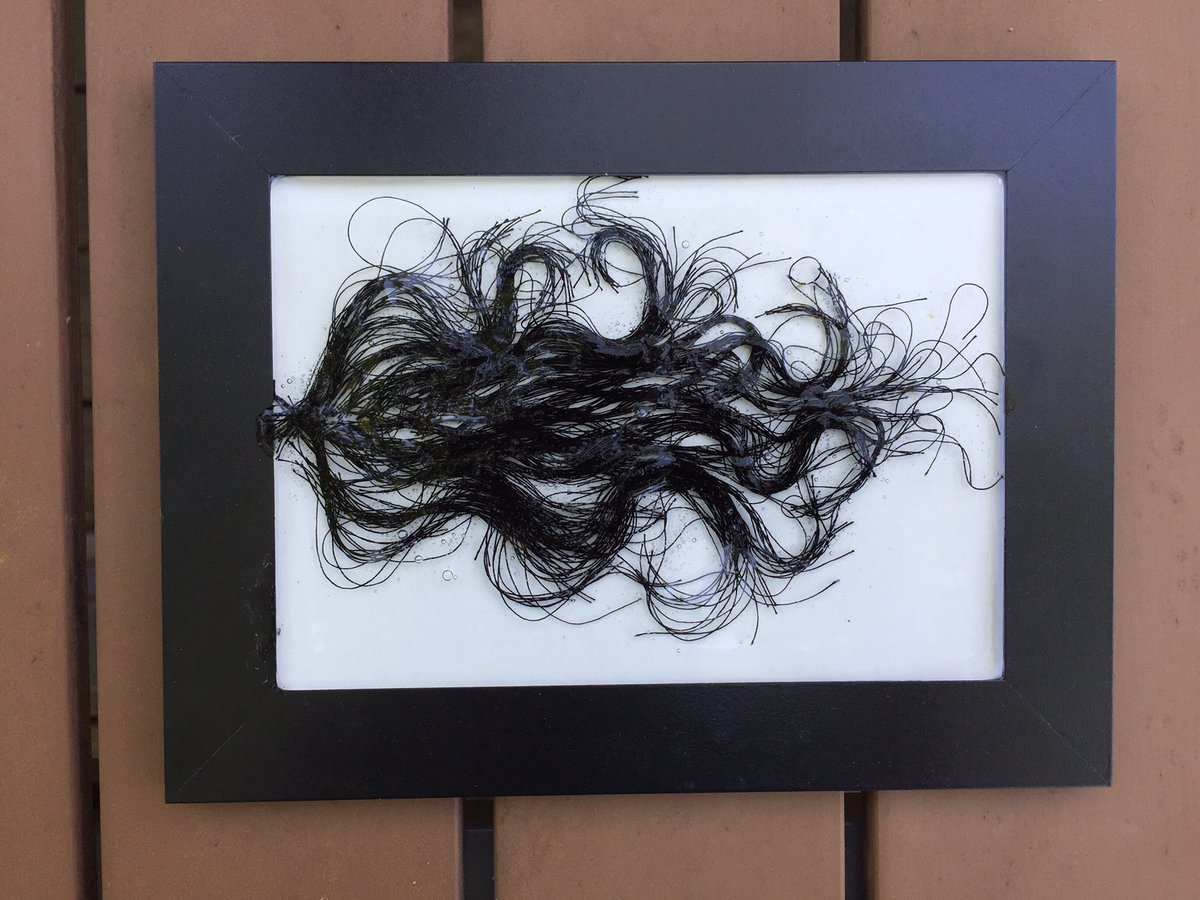
In the Most Beautiful category, the 5 judges initially selected 5 different winners! Eventually, they came to agreement on Patti Shih’s submission, comparing normal brain connectivity to connectivity “while tripping on magic mushrooms”:
(original)
“Patti was able to almost perfectly recreate the original dataviz using something as cozy as string. The choice of colors manages to make it even more visually appealing than the original.” – Emil Hvitfeldt
“Circos diagrams, although hard to gain insight from, are pretty. By sculpturing layers with string, Patti enhanced both their beauty and their informational value.” – Helena Jambor
Honorable Mention
The runner up in the Most Beautiful category was a twisted-metal tree representing a dendrogram of the students that Alli Torban’s (Host of Data Viz Today Podcast) mother taught throughout her career.

“The tree is very very beautifully done and photographed – serves both as reminder that tree-diagrams can be shown in 3D and is in itself almost a sculpture! “ – Helena
Most Informational
In this category, Amy Cesal’s two entries dominated; both of her Play-Doh-based visualizations won the most votes in the original round. They were also strong contenders in the Most Beautiful category. In the end, the judges selected the “joy plot” (aka ridgeline plot) of the Perceptions of Probability for its effectiveness in conveying the meaning of the original data visualization.
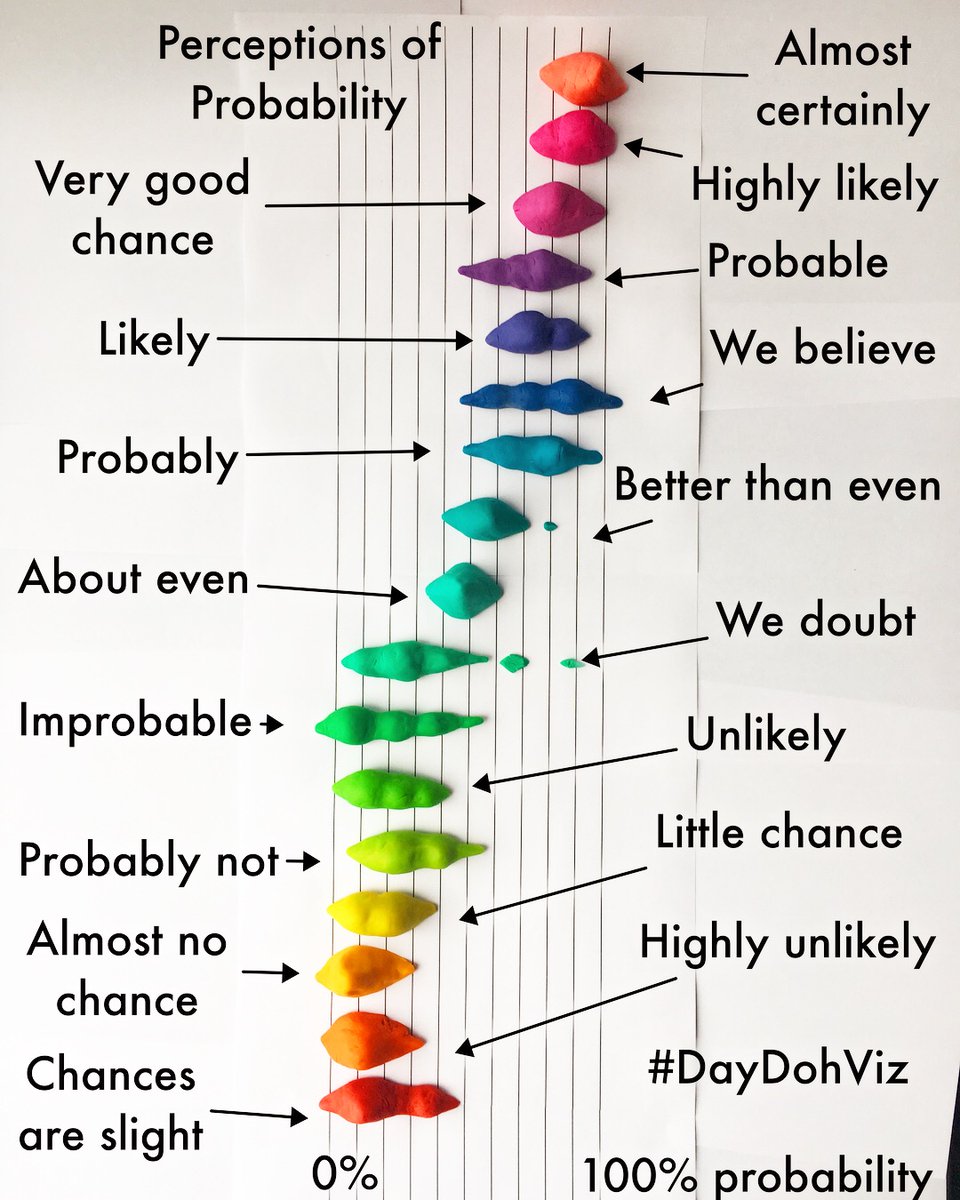
“Joy plots were recently re-popularized by @ClausWilke and are both fun and informative. Amy captured its full essence while choosing visually stunning Play-doh colors. Absolutely beautiful!” – Sean Law
Honorable Mention
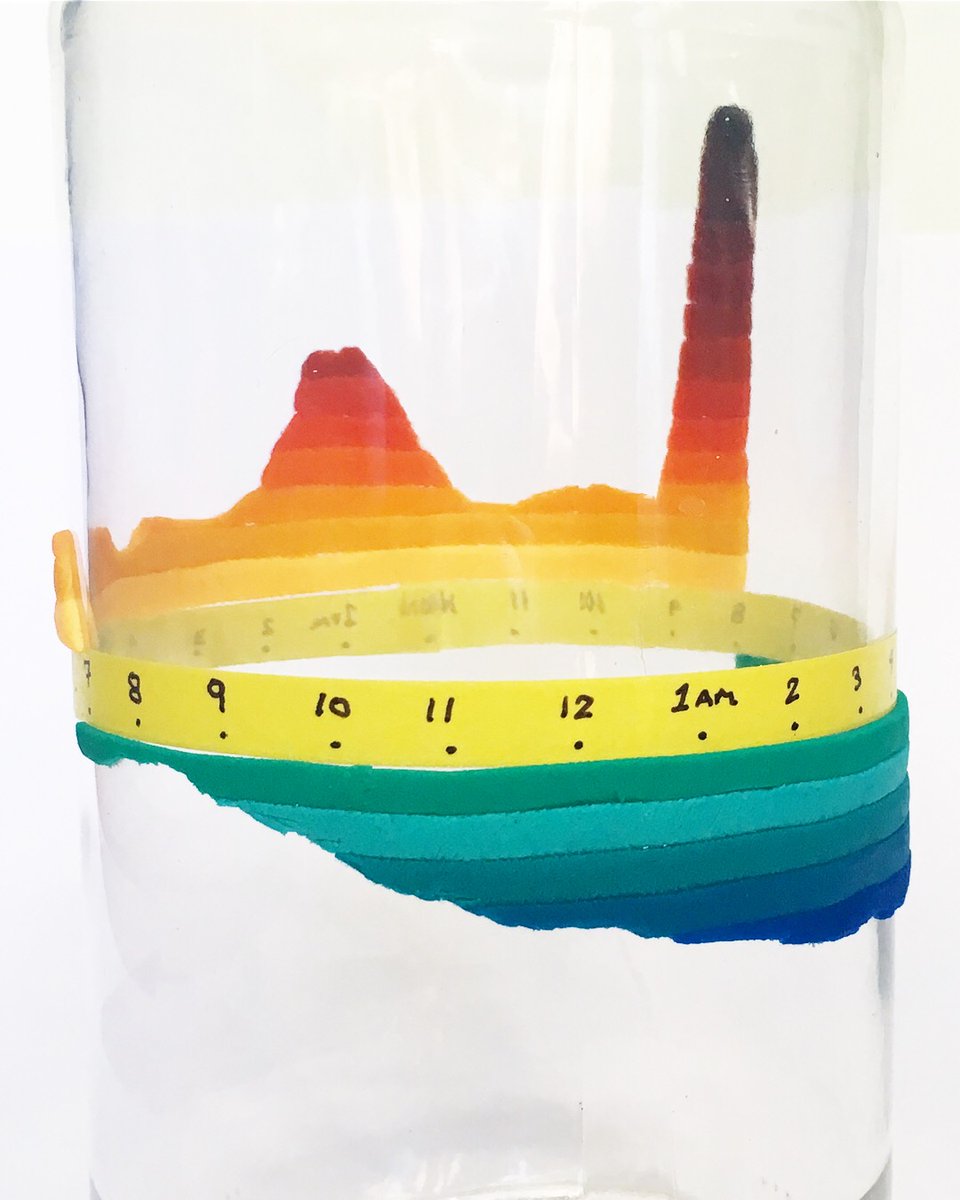
Amy Cesal’s 2nd entry on birth time patterns was the other top choice in the Most Informational category.
(original)
“A creative use of Play-doh on top of a 3-D object makes me a big fan of Amy Cesal. I never thought that Nadieh Bremer’s wonderfully informative work could be improved upon but this is one beautiful exception!” – Sean Law
“I loved that this crafty version made the original data viz more understandable due to adding another dimension. “ – Karen Lopez
Most Fun
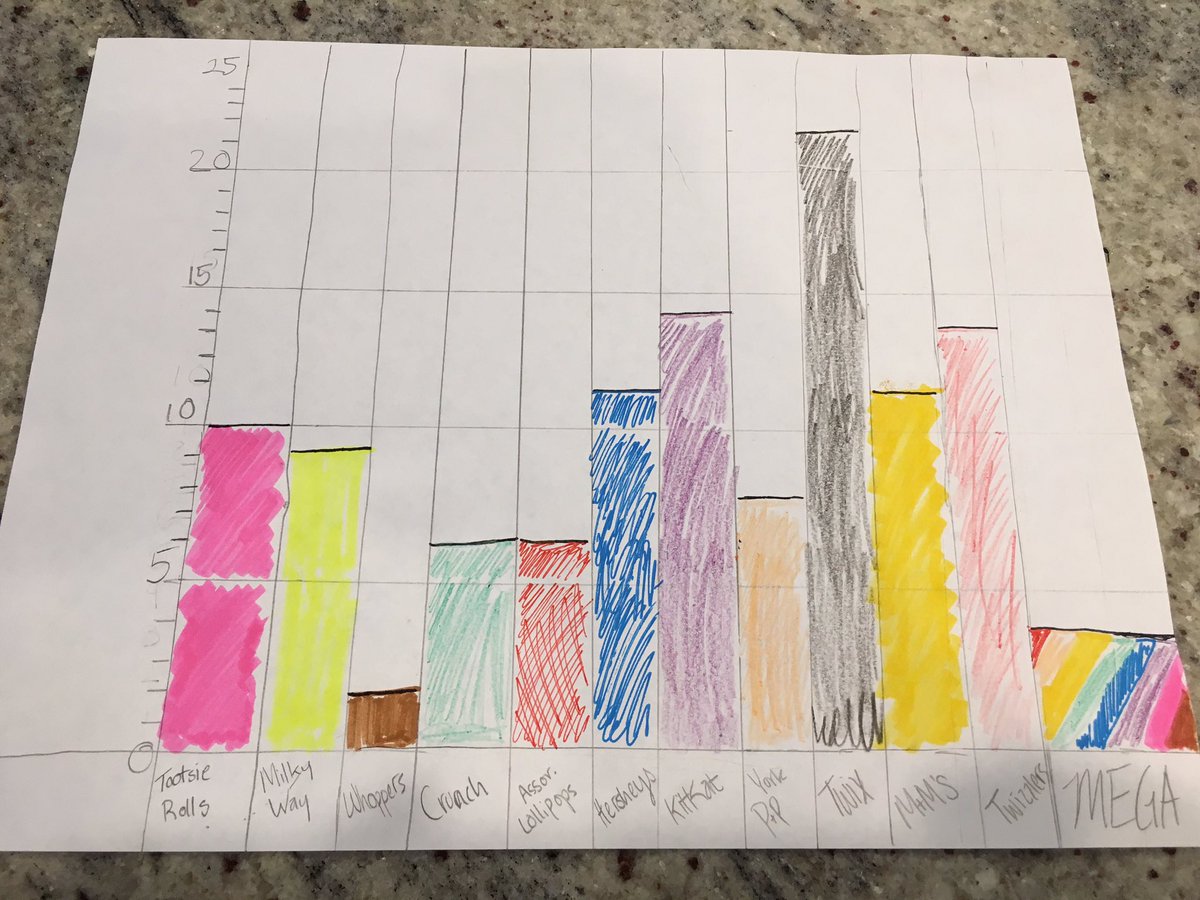
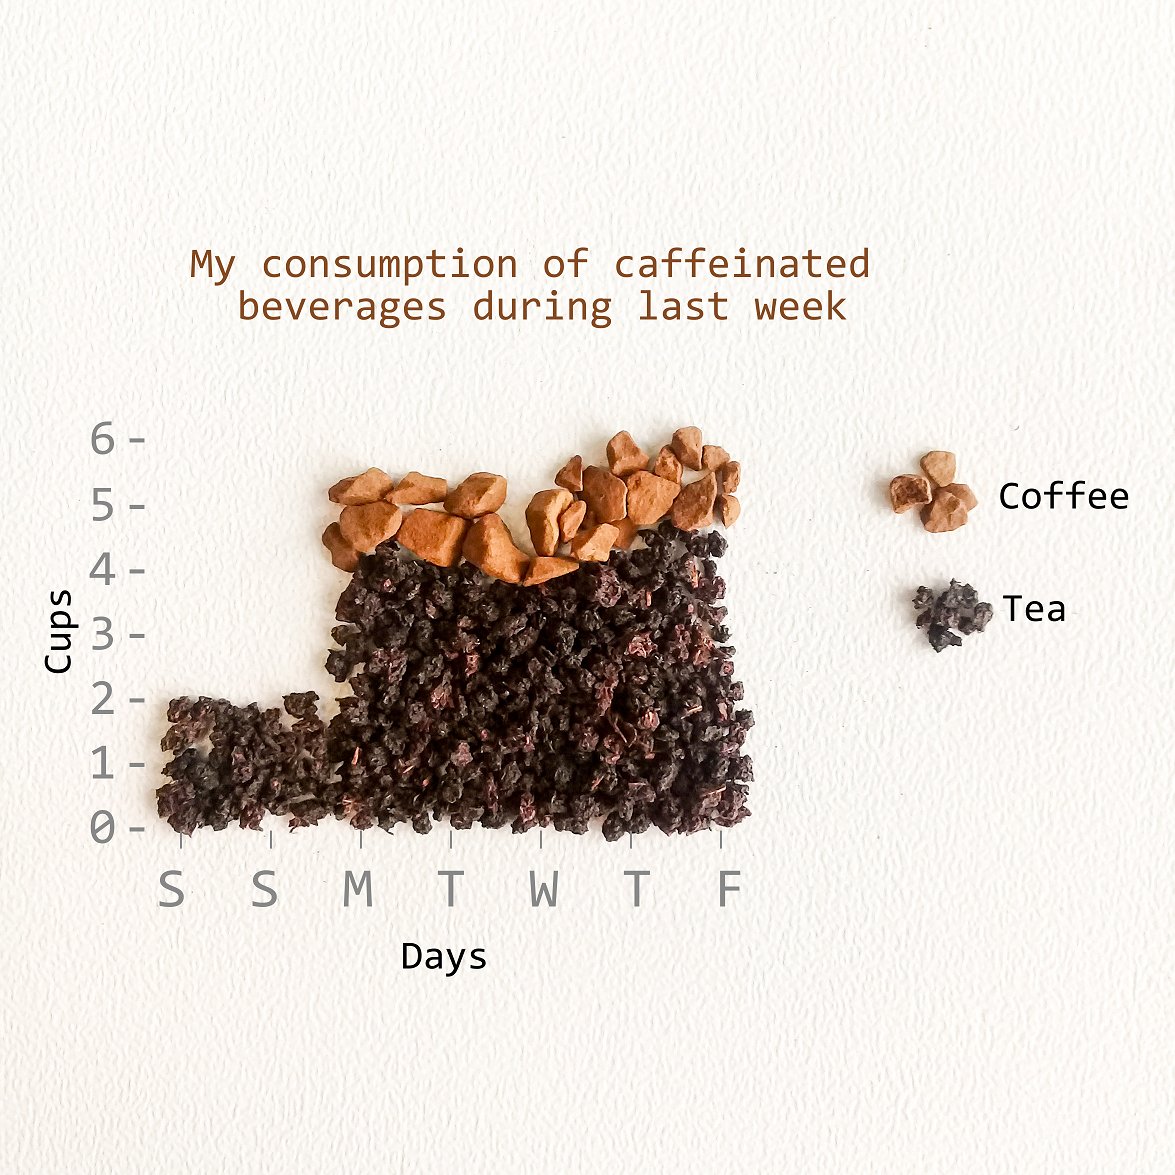
This subjective category also had multiple top picks in the first round of judging. After much deliberation, the judges chose Jon Schwabish’s daughter’s entry depicting her Halloween candy haul! Definitely fun, especially the mysterious “MEGA” category!
And to add to the fun, Hadrien Lacroix reverse-engineered a digital version!
“The joy and childlike wonder displayed in this dataviz brightened my day, which makes this project my choice of “Most Fun”!” – Emil
“The author’s clear zest for each individual data point (ie piece of candy) really shone through!” -Natasha
Honorable Mentions
The judges also thought that Awais Athar and Alli Torban‘s entries were especially fun and interesting!
The 3 category winners will get their choice of item from the Becoming a Data Scientist store. Congratulations! And thank you to every person who entered the #CraftyDataViz contest – there were many more awesome entries than we could depict here. This was truly amazing, and I can’t wait to do it again next year! Check out all of the impressive entries in this Twitter Moment!
]]>
But I’m sure the main thing you’re here to find out is how to get involved yourself! So, here are the basics:
How to participate in the Summer of Data Science:
- Pick a thing or a short list of things related to data science that you want to learn more about this summer (or this winter if you’re in the southern hemisphere!)
- Make a plan to learn it (like an online course, a practice project, etc.).
- Share that plan on social media, then post updates as you make progress, with the hashtag #SoDS18.
Here’s a twitter moment with a bunch of entries from #SoDS17 for reference!
We’ll run this one from today – May 28, 2018 – through Labor Day in the U.S. – September 3, 2018. What you can realistically get done in that time depends on where you are in your data science learning journey, what your work schedule and family obligations are like, and many other factors – so think about what’s realistic for you to accomplish during this time.
Week 1 will be about brainstorming and researching possibilities and resources for summer projects, courses, etc. And in Week 2 we’ll set specific goals for the rest of the summer. So, start thinking of ideas now!
If you would like some ideas for beginners, here’s a list of beginner content on my site DataSciGuide:
Recommended Resources for Beginners
You might want to pick a book or course and go through it, trying out the exercises this summer.
I also have a Flipboard where I have collected a bunch of Data Science Tutorials you might want to check out (note: these aren’t all aimed at beginners).
There are also a whole bunch of online communities where you can join others in a project, or ask questions if you get stuck on yours. I’ll be writing another post highlighting those this week!
Follow me on twitter @becomingdatasci, and tweet with the hashtag #SoDS18 when you post updates about your progress! (It’s a good idea to “thread” your tweets throughout the summer, or add them to a Twitter Moment, so others can easily follow along!)
I’ll be retweeting a bunch of people’s ideas and resources, so keep an eye out there for more ideas if you aren’t sure where to start!
]]>Enjoying this bot account
https://t.co/uRTj3LWgDm
— Data Science Renee (@BecomingDataSci) April 24, 2018
Today, I saw this tweet:
you could replicate this by gluing various dried out legumes to poster board if you wanted to https://t.co/icHeUuy4Ob
— Rebecca Williams (@internetrebecca) May 5, 2018
and imagined a census tract visualization made out of dried noodles and beans. Being as spontaneous as usual, I asked if anyone would be interested in having a #CraftyDataViz contest, and several people responded yes! So, here we are. Time to get creative!
Basic Contest Rules:
Find a data visualization online, in a book, or create one yourself. We need a digital version of the viz you’re recreating, so save the link or take a photo of it. Now, gather up some goodies from around the house or yard and/or hit the craft store (or maybe the grocery store!) and recreate that data viz in craft form!
It does need to be a physical end-product – no completely digital entries (though usage of printed elements is ok), but other than that there are no restrictions on materials or approach – get as creative as you want! At least part of it needs to be handmade or manually assembled (so no completely 3D-printed entries, for instance, but parts could be 3D printed) You can replicate the viz in detail, or do an abstract interpretation of it :)
I will find some judges that know something about data visualization, and they will pick winners in each of the following categories (we might do some sort of online vote to narrow down the entries, depending on how many there are):
- Most Beautiful/Visually Impressive – as long as the judges can tell it’s related to the original data viz in some way, it qualifies, and the judges will pick the overall most gorgeous or awe-inspiring outcome to win this category
- Most Informational – to win this category, your visualization needs to be especially readable/interpretable. Judges will pick the one that most effectively communicates the point of the original data viz
- Most Fun! – the definition of this is up to the judges, but if it makes the judges laugh, it probably has a good chance at winning
The winner of each category will be featured here and on my @becomingdatasci twitter account, and win their choice of item from the Becoming a Data Scientist store! By then, I’ll have the 2018 Summer of Data Science items up, since the end of this contest will also mark the launch of #SoDS18!
How to Enter:
Post a tweet (or a comment below if you don’t use twitter) that includes a link or image of the original dataviz, as well as a photo or video of your creation! On twitter, use hashtag #CraftyDataViz so I can find your entry!
The entry period starts today and ends on 11:59PM EDT on Sunday, May 27. I’ll plan to post the entries for viewing/judging on Monday, May 28 (Memorial Day in the United States).
HAVE FUN!! I’m excited to see what you create!!
]]>My interest in this topic started long ago, and I partially based this talk off of my blog post “A Challenge to Data Scientists” from 2015. There are a ton of links throughout, and I included the slide notes so you have those along with the presentation (I’m not sure why all of the URLS aren’t automatically linked, so you have to copy and paste some, sorry.) I’m prepping for another presentation right now and don’t have time to write a whole lot about it – so without further ado, here are the PDF files with the slides and the notes:
Just noticed the link above still doesn’t contain all of the notes and links… I need to figure out how to save that to PDF in the right format from Powerpoint. For now, here’s the full slide + notes view with all links. Just don’t print it – it’s almost 100 pages long!
SLIDES WITH NOTES & LINKS
Update: There’s a video on YouTube of this talk and the panel that followed!
]]>Here’s a video of me explaining the analysis:
A few notes as I skim through:
- That part that was broken is where I hadn’t changed from the real IP to the random IP (sorry search bot), so I fixed that in the file below
- I pointed to the wrong thing when I was talking about how long I’d been around…Becoming a Data Scientist Podcast started in December 2015! So 1 year later there was a day larger than the 1st day for the 1st 3 episodes.
- The top IP that got 36 views – I’ll have to look into it, but I think it could be multiple IPs getting assigned the same random number. I’ll take a look and come back when I have a chance.
Here are all of the episodes, so you can go back and listen to any you missed!
You can download the HTML versions of my Jupyter notebooks, and also play with the Tableau dashboards at these links:
“Clean” version of the Jupyter notebook
Full messy analysis Jupyter notebook
Listen monitoring Tableau dashboard
Interactive episodes by week Tableau dashboard
If you have suggestions for how to do the code in a more sensible way than how I rushed and did it, or if you have any questions, feel free to add suggestions in the comments below!
]]>If you haven’t signed up for the conference yet, it’s free online, going on now (10am to 10pm 9/27/2017) and you can sign up at this link. Everyone who registers will get access to the videos afterward.
Here’s some stuff to help you on your data science journey!
Becoming a Data Scientist Podcast
- Audio on iTunes (or other “podcatcher” apps – just search “Becoming a Data Scientist”)
- Video on YouTube
- Twitter list of podcast guests
DataSciGuide Data Science Learning Resource Directory
Recommended Learning Resources for Beginners
@becomingdatasci (me!) on twitter
My Flipboard Magazines – Becoming a Data Scientist, Data Science Tutorials, and Bias in Data Science
Twitter list of over 1200 Women in Data Science and related disciplines to follow!
And some blog posts from this blog I’d like to highlight:
- PyData DC “Becoming a Data Scientist – Advice from my Podcast Guests” Talk (Longer version of the talk I gave today)
- A Challenge to Data Scientists – on bias in machine learning
- Introductory Machine Learning Terminology with Food
- Summer of Data Science (Southern Hemisphere edition coming soon!)
- Boosting as a Metaphor for Diverse Teams
Thanks to Metis for hosting the Demystifying Data Science conference today! If we’re able to post the videos of our talks publicly in the future, i’ll post it here.
Thanks for dropping by! Connect with me on twitter for any follow-up questions!
]]>Feeling another set of parody lyrics coming on. Maybe will write down this week. Guess the data science theme?https://t.co/flpIozxz8x
— Data Science Renee (@BecomingDataSci) May 1, 2017
and I was reminded of it today by this tweet
Just a Neural Net
Livin' like a marionette
She took the TCP goin' anywhere
Just a chatroom bot
Born and raised on reddit thought
…— J. Nathan Matias (@natematias) July 29, 2017
So, I wrote it down to share my silliness with you. Enjoy!
I can fit every point
feature high info gain
but I’m over you asking me when you know I’m not okay
I learned really well
from the training that night
and though I can classify you know I’m just not right
I can’t generalize
I’m overfit
Too complex
I’m overfit
Tricked by noise
I’m overfit
I’m overfit
I’m over
Wanting you to be wanting me
But, my low accuracy
To outliers I’m sensitive
Because I’m so over
I’m overfit
Moving on, it’s too late
I didn’t pass cross validate
Tried so hard to relate
and now I’m so… so overfit!
You can go get more points
Build more models to help
You can regularlize with layers that drop out
Oh that’s why I’m done
I’m overfit
Was fun but
I’m overfit
I’m not the one
I’m overfit
I’m overfit
I’m over
Wanting you to be wanting me
But, my low accuracy
To outliers I’m sensitive
Because I’m so over
I’m overfit
Moving on, it’s too late
I didn’t pass cross validate
Tried so hard to data relate
and now I’m so… so overfit!
Don’t ask me to classify
Ain’t no use don’t ask me why
I’ll never change
Unless… tweak my parameters and run me again
Wanting you to be wanting me
But, my low accuracy
To outliers I’m sensitive
Because I’m so over
I’m overfit
Moving on, it’s too late
I didn’t pass cross validate
Tried so hard to relate
and now I’m so… so overfit!
(P.S. here’s the Wikipedia article on overfitting in machine learning!)
]]>2. I published a post over on DataSciGuide about resources for data science beginners. Check it out!
Thanks for your continued readership here!
P.S. I’m working on the podcast again, so the 2 already-recorded episodes are back in the work pipeline :)
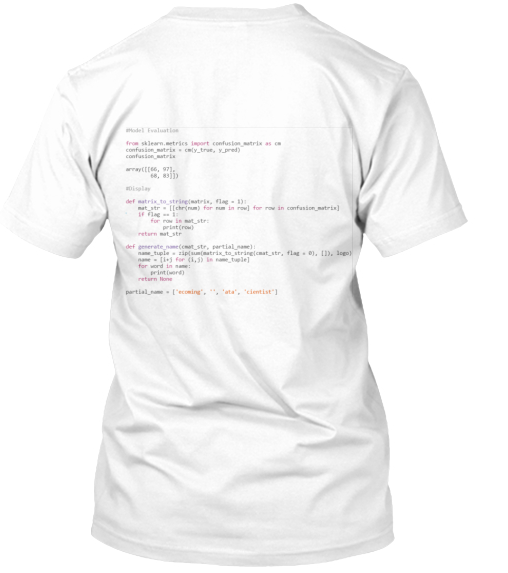
]]>Machine Learning Algorithm
A machine learning algorithm is a list of instructions to guide a computer to analyze some data to find patterns, and works much like a cooking recipe. You put some data in (ingredients), do some stuff to it (preparation and cooking), and then evaluate how the results compare to what you were hoping to accomplish (photo in your cookbook and expectations of taste).
Input Columns (Features) -> Ingredients
Features are basically columns in your spreadsheet that you choose to input into an algorithm, and they’re like ingredients in a recipe. If you’re going to make cookies, you’ll need some ingredients like eggs, flour, and chocolate. These ingredients get stirred together and then baked, and the output is a (hopefully) edible cookie.
Feature Engineering -> Ingredient Prep
Some ingredients, like eggs, aren’t added to the recipe as-is. You have to crack the egg, sometimes separate the whites from the yolk, and maybe beat the egg before adding it to your recipe. The same goes for the features, or columns in your spreadsheet. For instance, you might have a column that contains categorical values in text form, and some algorithms will require you to first transform that column into a bunch of yes/no columns that “encode” the feature into binary values. If, for instance, you have category values listed in your original column like “category A”, “category B”, and “category C”, you might convert the 1 column to 3 columns – one for each category – and instead of the spreadsheet cells containing words, they now contain a 1 or a 0 in each category column indicating “yes” or “no” for each category. An algorithm that couldn’t understand the phrase “category A”, can now understand it as a value of “1” in the Category A column.
Number of Input Rows / Volume of Data -> Batch Size
Changing the number of rows of data in your spreadsheet (each row containing a bunch of “features” – or columns) is like scaling the measure of ingredients in your recipe. If you want a double batch of cookies, you can add twice as much of each ingredient into your bowl, and get twice the cookie dough. If you only have half of the amount of flour called for by the recipe, you can halve all of the other ingredients to get half of a batch. You have to beware of modifying how many rows of data you input into your algorithm, though. Like in cooking, adding or removing rows can sometimes have an unexpected effect on the output. If you split a bowl of cookie dough in half, but almost all of the chocolate chips end up in one half and almost none are in the other half, you won’t get two identical batches of cookies! The distribution of values contained in the rows of data you input into your machine learning algorithm impacts the resulting model.
Clean CSV -> Pre-prepared meal kit
In data science courses, you often start assignments with a pre-cleaned spreadsheet. This is like receiving a meal kit delivered to your door. You get the correct amount of each ingredient, and they are often already prepared or just need a little chopping. This is great for learning, but don’t be surprised when you get to a real-world scenario and you are expected to shop for the ingredients, hope they are available for purchase at your local store, make some substitutes, and then figure out how each ingredient you bought needs to be transformed in order for the recipe to work! It makes sense to start out as a short-order cook before you learn the skills and art to being a chef, so there’s nothing wrong with using “meal kits” to start out!
Type of Model/Algorithm -> Cooking method
Now that you have all of your ingredients prepared, what do you do with them? If you’re cooking, that batter could be baked into a cake, or fried into a donut. If you’re doing data science, your spreadsheet could be run through a variety of algorithms to generate different types of models, to see how each turns out. This is called “model selection”. You might use linear regression or a decision tree, for instance. Just like with cooking, different “ingredients” (features) work better with certain cooking styles (types of models). And some people – machine learning researchers – are exploring entirely new methods of “cooking”!
Model Parameters -> Cooking settings
Now that you’ve chosen to bake your cookies, at what temperature do you bake them at? And for how long? This depends on what you are trying to optimize for. Do the people eating the cookies like them more caramelized and don’t mind them being a little burnt around the edges? Or do they like them soft with no dark spots? Some of that is affected by the ingredients you put in, but it’s important to find a good oven temperature and cooking time combination. In machine learning, this is called “parameter tuning” or “hyperparameter optimization”. There are methods for working through different combinations of parameters (settings) to find the best one for the outcome you want to achieve. Note that if you change the ingredients (features), the settings that worked with your last batch of dough may not be the best for your new one. And a good temperature for frying might not be a good temperature for baking!
Also note that I mentioned you have to choose what to optimize for. If you have an audience that has different cookie preferences, you can tweak your model toward one or the other, or try to balance between the two. There are always human choices made in “machine learning”, and every choice is a trade-off! (same goes for choosing which rows and columns to input into your model, not just parameters)
Output Features / Target Variable -> Ideal Cooked Food Outcome
We talked about input features (ingredients), but why are we doing all this “cooking”? We’re trying to achieve some sort of target, which we mentioned a bit earlier when talking about parameter tuning. How do we know what target we’re trying to hit? In supervised machine learning, you have some rows where the output is known, so you can train your model. This is like having a photo of the finished product in a cookbook, and having tasted what a good outcome of the recipe tastes like. You have a target toward which you are trying to optimize. If you say it is “too salty”, you’re comparing the saltiness of your result to some ideal saltiness. That ideal is the “target”, and in supervised machine learning, is encoded in the “output feature” – a column in your spreadsheet that contains a value for each row that identifies how that row should be categorized by the resulting model, or what number the algorithm should generate.
Model Evaluation -> Tasting/Looking at Result, Comparing to Recipe Expectations
Once you’ve run your features through a model (cooked your ingredients with a particular method and settings), you need to evaluate how well the results turned out. In cooking, you’ll often have some taste-testers and you can also compare how the final plated dish looks when compared to the photo in the cookbook. As mentioned before, you can optimize for different things. You might make a dish that looks beautiful – exactly like the photo! – but tastes horrible. (Maybe they staged the photo with fake food and no one can make it look like that with the given recipe!)
So, if your “evaluation metric” of taste is way off, you go back and tweak your ingredients (features), ingredient prep (feature engineering), parameters (oven settings), and batch size (volume of data and which rows are included) until your outcome meets your chosen ideal. Or, if you think the outcome is just fine, it might be the taste testers (metrics) that need rethinking!
———————–
Types of machine learning algorithms.
These next few examples get away from the “recipe” example I’ve been using so far, but still use food to attempt to explain the concepts.
Imagine that you have a big bowl of trail mix. Your job is to teach a child to separate the trail mix into its components. This is like taking a big spreadsheet of data, and figuring out how to group the rows into categories. Each piece in the trail mix corresponds to one row in your spreadsheet.
You notice that the bowl of trail mix contains nuts, candy, and pieces of cereal. You point out each ingredient to the child, explaining “see, this is a peanut, a type of nut”, “this is an M&M, a type of candy”, tell the child to separate them out into piles, and walk away. (Don’t be surprised if some of your “data” is missing after this project!)
CLASSIFICATION
You come back and see that the child has created two piles: One has peanuts, cashews, and almonds in it. The other has M&Ms, chex, cheerios, and raisins in it. This child understood the task as a classification task, and acted as a “nut or not” classifier! He heard you describing the items as nuts, candy, or cereal, ignored the specifics, and decided to do a simple separation into 2 piles: one with nuts, one with non-nuts.
I could go into detail here about confusion matrices and evaluating this child’s performance, categorizing true positives (nuts correctly identified as nuts), false positives (non-nuts identified as nuts), true negatives (non-nuts identified as non-nuts), and false negatives (nuts identified as non-nuts), but getting into the details of these measures would make this article way longer than it needs to be, and I’m just trying to cover the high-level types of algorithms.
This “nut classification” algorithm worked because the child identified features of the items that made certain pieces nut-like (hard, brown, salty), and features that made them non-nut-like, and categorized them into piles based on how nut-like they were.
Even though you left the child unsupervised during this process, the type of machine learning is called “supervised learning“, because you first told the kid what each item was, so he had “labels” for what was a nut and what was not a nut, to learn which features went with each classification.
CLUSTERING
You call over another child. You decide not to tell her anything about the items in the bowl, but tell her that she needs to divide the items in the bowl into piles, hoping she’ll separate them into nuts, candy, and “other”, but not telling her that. You want her to do more than just the “nut or not” that the first kid did, so you tell her to divide them into at least 3 groups. Because you didn’t tell her information about how to categorize each item in the bowl, this is an example of “unsupervised learning” (even if you watch her do it).
She stares at the bowl for a while, and you leave her alone to do the task. When you come back, there are 3 piles. One has nuts, raisins, cereal, and brown M&Ms in it, and then there is a pile for each color of M&Ms! She has “clustered” the items based on color similarity. She gave you more than 3 groups, but since you didn’t label the items, she picked color as what made the items most similar to one another. So you got a large brown pile that contained most of what was in the bowl (since most of the trail mix was brown), then small piles of blue, red, orange, yellow, and green M&Ms.
REGRESSION
You decide to try the same exercise and call over a third child. This time, you just tell the kid to organize the bowl however she wants, and watch from a distance. To your dismay, she is licking every piece! You rush over and see that she has lined up all of the pieces on the ground. Most of the M&Ms are toward one side of the line, and as you go down toward the other end of the line, you see mostly nuts and cereal. “What were you licking them for?,” you say. “Well duh, I had to see how sweet they each were!” she replies. She has sorted them in one dimension – testing only for sweetness, and ordering every piece into a line based on how sweet it was.
This isn’t the best example of regression – but the point is that you got a value as an output – sweetness level – as opposed to a category. It’s possible to use this sweetness level to then create categories – like creating a “candy” category by picking a certain sweetness level, and saying that anything above that is candy.
If you are given a new piece of trail mix, you could compare it to trail mix in the already-licked line, and probably make a good guess about how sweet it is based on how much it looks like the pieces in a particular part of the line.
I hope this helps clarify some machine learning terminology for people who like food metaphors! Add your own food-machine learning metaphors or ask questions in the comments!
]]>The Summer of Data Science is a commitment to learn something this summer to enhance your data science skills, and to share what you learned. (Those of you in the Southern Hemisphere will have to pick up the excitement when we’re winding down during our fall/your spring and keep it going! Or, join us during your Winter of Data Science!)
For those of you who haven’t been following me for years, a hashtag I started back in 2015, #SoDS, is actually one of the things that started growing my twitter following. Here’s the history:
1st month of tweets, May 2015 Storified
Unfortunately, I didn’t keep up the ‘Storification’ after that, but you get the idea. It brought a bunch of us together to share our learning progress. We learned from each other, encouraged each other, and most of all geeked out about data science together!
I didn’t launch one last year, because I was starting a new job and taking a break from recording the podcast, and just didn’t want to take on too much. But I missed it, so I didn’t want to let another year pass without a Summer of Data Science, so we’re going to do it together again this year!
So, here are the only “rules”:
How to participate in the Summer of Data Science:
- Pick a thing or a short list of things related to data science that you want to learn more about this summer.
- Make a plan to learn it (like an online course, a practice project, etc.).
- Share that plan on social media, then post updates as you make progress, with the hashtag #SoDS17.
That’s it! (And yes, there’s a chef competition that used the same hashtag. No worries! Enjoy the food pics.)
If you’re looking for ideas for learning projects or topics, check out the Data Science Learning Club! Please write about your learning experiences and share in the Data Science Learning Club #SoDS forum, and/or on your own blog, and share on social media. I’ll check out the hashtag on twitter regularly and RT others. I’ll be participating myself, too!
Here’s a link to the hashtag on twitter: #SoDS17. See you there!
P.S. Did you know that there is a “Summer of Data Sci” song? :D
P.P.S. There are now Summer of Data Science 2017 t-shirts and tanks in the Becoming a Data Scientist teespring shop!
UPDATE: Here is a twitter Moment with a selection of tweets from the #SoDS17 participants this year! (It starts out with a bunch of intro tweets from me, but click through to twitter and keep scrolling!)
Summer of Data Science 2017
Renee interviews Randal S. Olson, Senior Data Scientist in the Institute for Biomedial Informatics at UPenn, about his path to becoming a data scientist, his interesting data science blog posts, and his work with non-data-scientists and students.
Podcast Audio Links:
Link to podcast Episode 16 audio
Podcast’s RSS feed for podcast subscription apps
Podcast on Stitcher
Podcast on iTunes
Podcast Video Playlist:
Youtube playlist of interview videos
More about the Data Science Learning Club:
Data Science Learning Club Welcome Message
Data Science Learning Club Activity 16 – Genetic Algorithms
Data Science Learning Club Meet & Greet
Mentioned in the episode:
Dr. Kenneth Stanley at the University of Central Florida
Michigan State University Artificial Intelligence
BEACON NSF Science and Technology Center at MSU
- Here’s Waldo: Computing the optimal search strategy for finding Waldo
- Computing the Optimal Road Trip Across the U.S.
- Computing Optimal Road Trips on a Limited Budget
- Machine Learning Madden NFL
Moneyball (book)
Data Science Handbook (book)
]]> ]]>
]]>(Readers told me that the link above doesn’t discount at all for International shipping, so if you are outside the US, use this link for $3.99 off – equivalent to US Shipping cost)
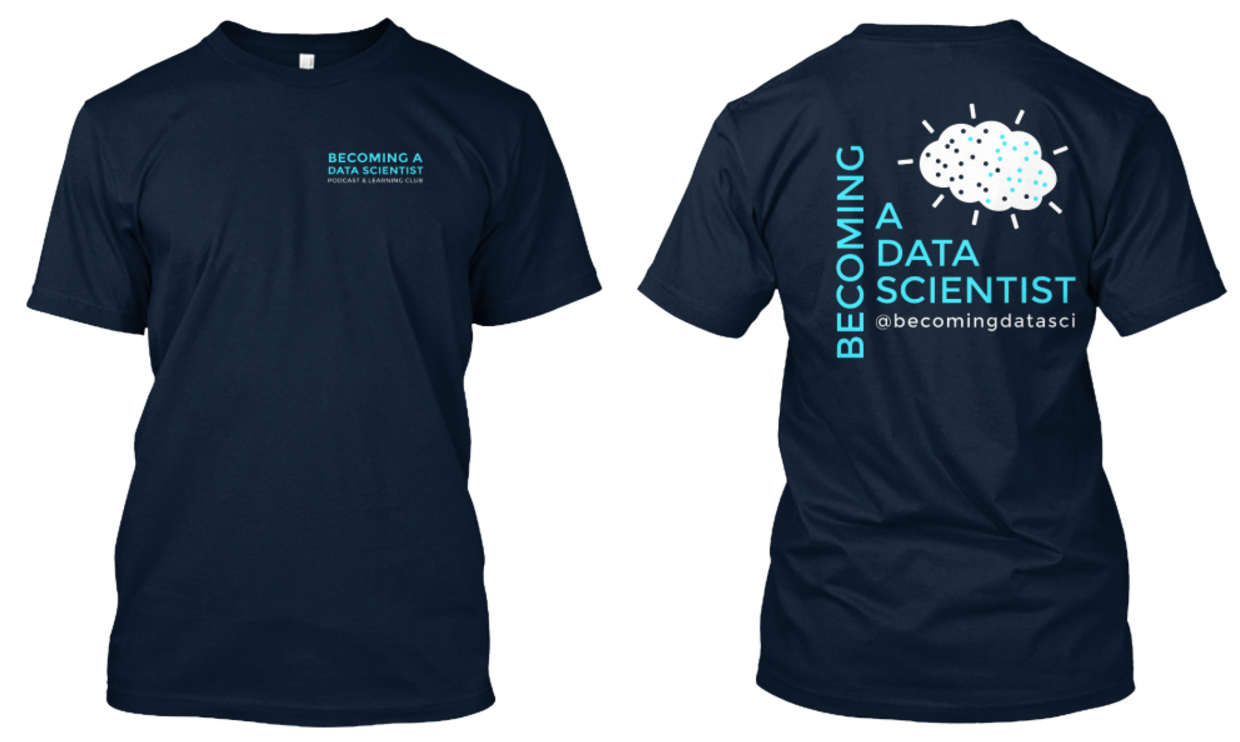
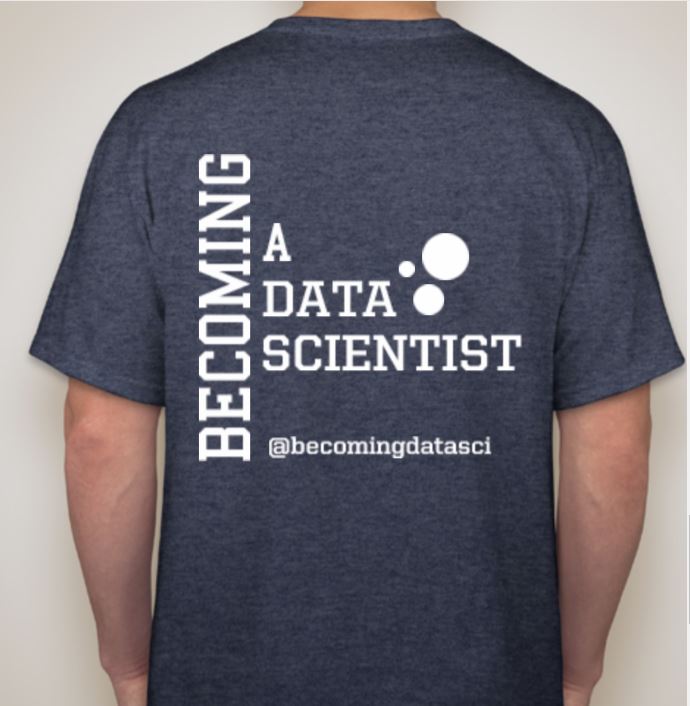
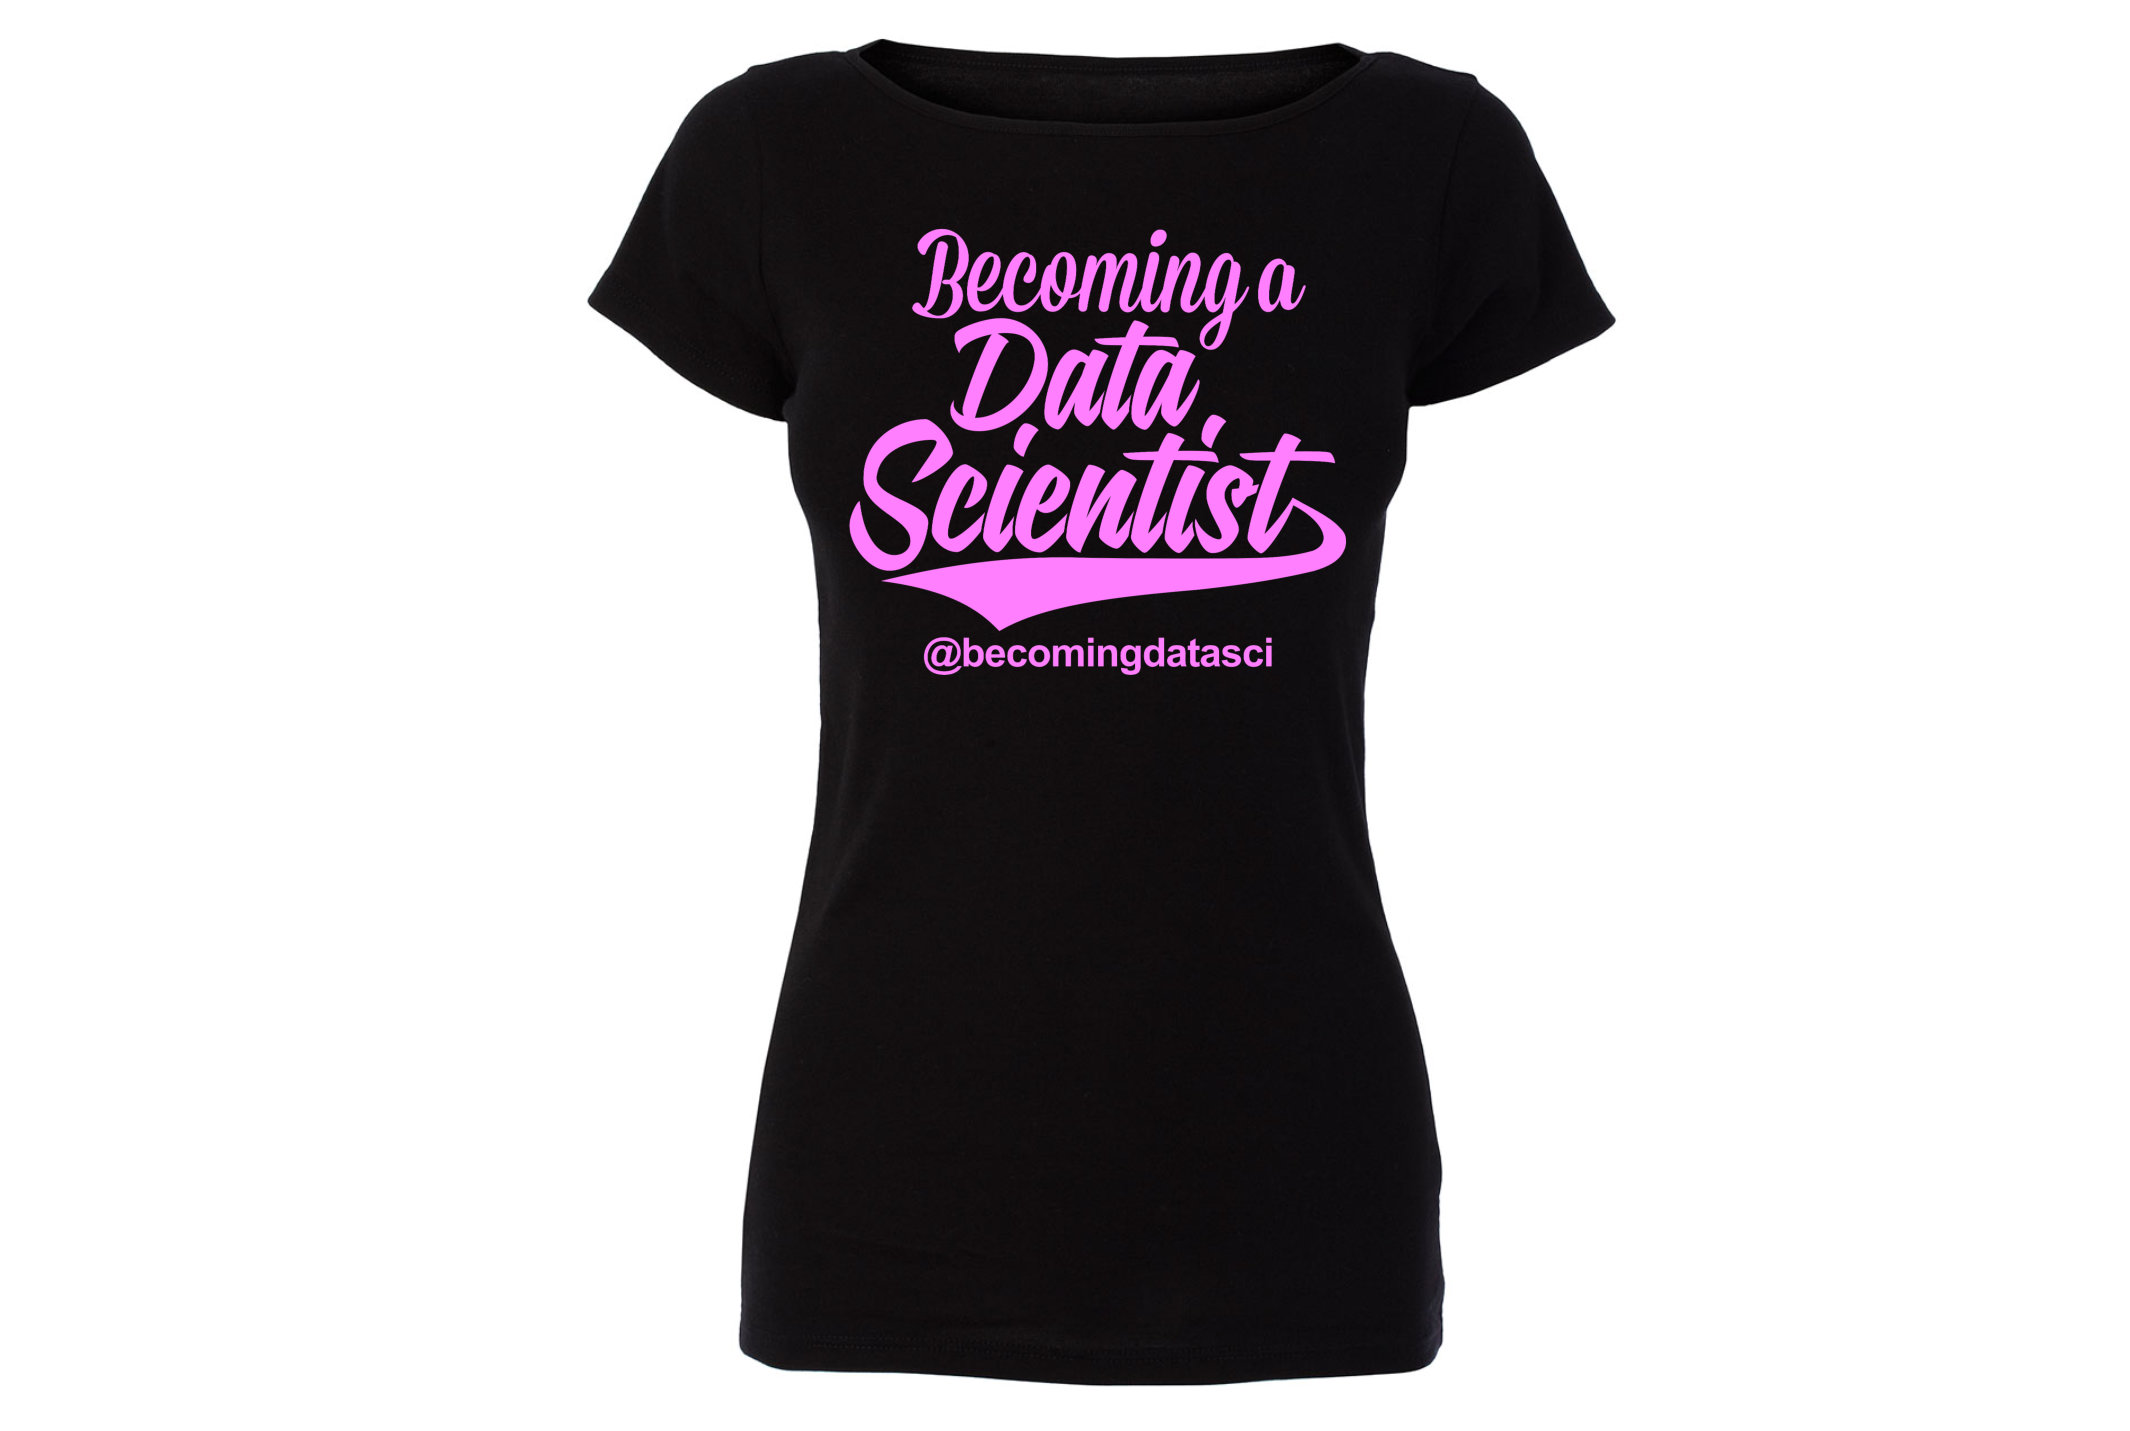
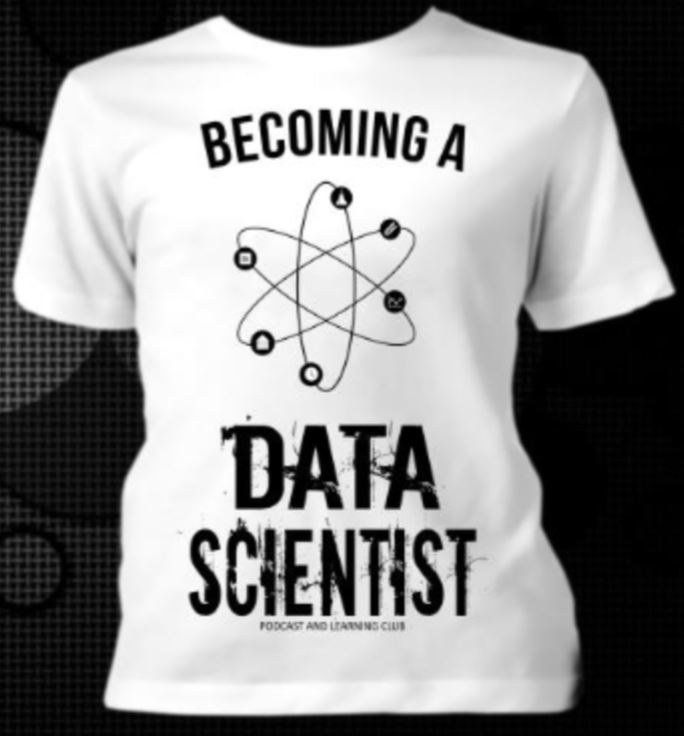
The design is a combination of those submitted to our contest by Amarendranath “Amar” Reddy and Ryne & Alexis. You can see their design submissions and read more about them on the finalists post! They are each receiving prizes for being selected. Thanks Amar, Ryne, and Alexis for the awesome design!
There are a variety of styles and colors available. The Premium Tee is 100% cotton. The Women’s Premium is a 50/50 cotton/poly blend, and is cut to fit more snugly. They are available in navy blue, gray, purple, and black. There’s even a long-sleeve version!
I make anywhere from $2-$7 on each order (it’s print-on-demand, so not cheap enough for me to make a significant profit yet, and my proceeds will be lower with the free shipping offer, but I want to reward those of you who are excited to flaunt your Becoming a Data Scientist status!) and every dollar earned from these will be going to the fund that helps support my new small team of assistants, who you’ll meet soon! Also, the more of them I sell, the lower the cost to print is per shirt, so please share with all of your friends!
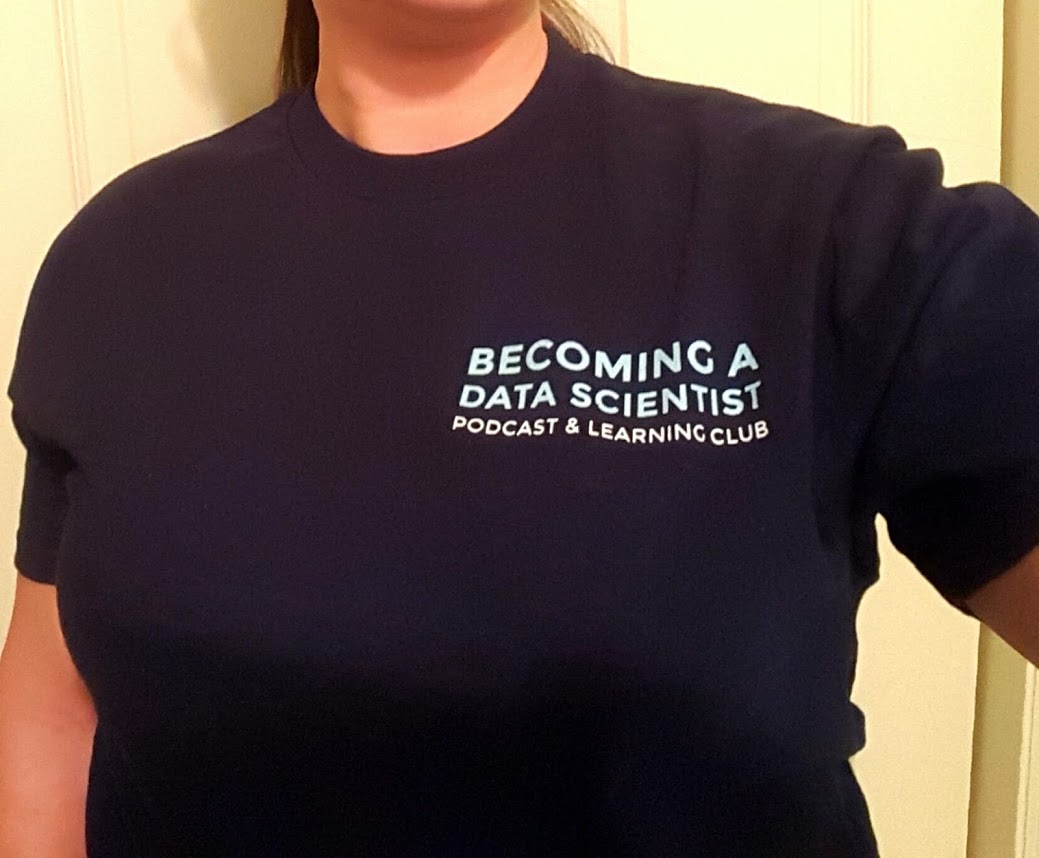
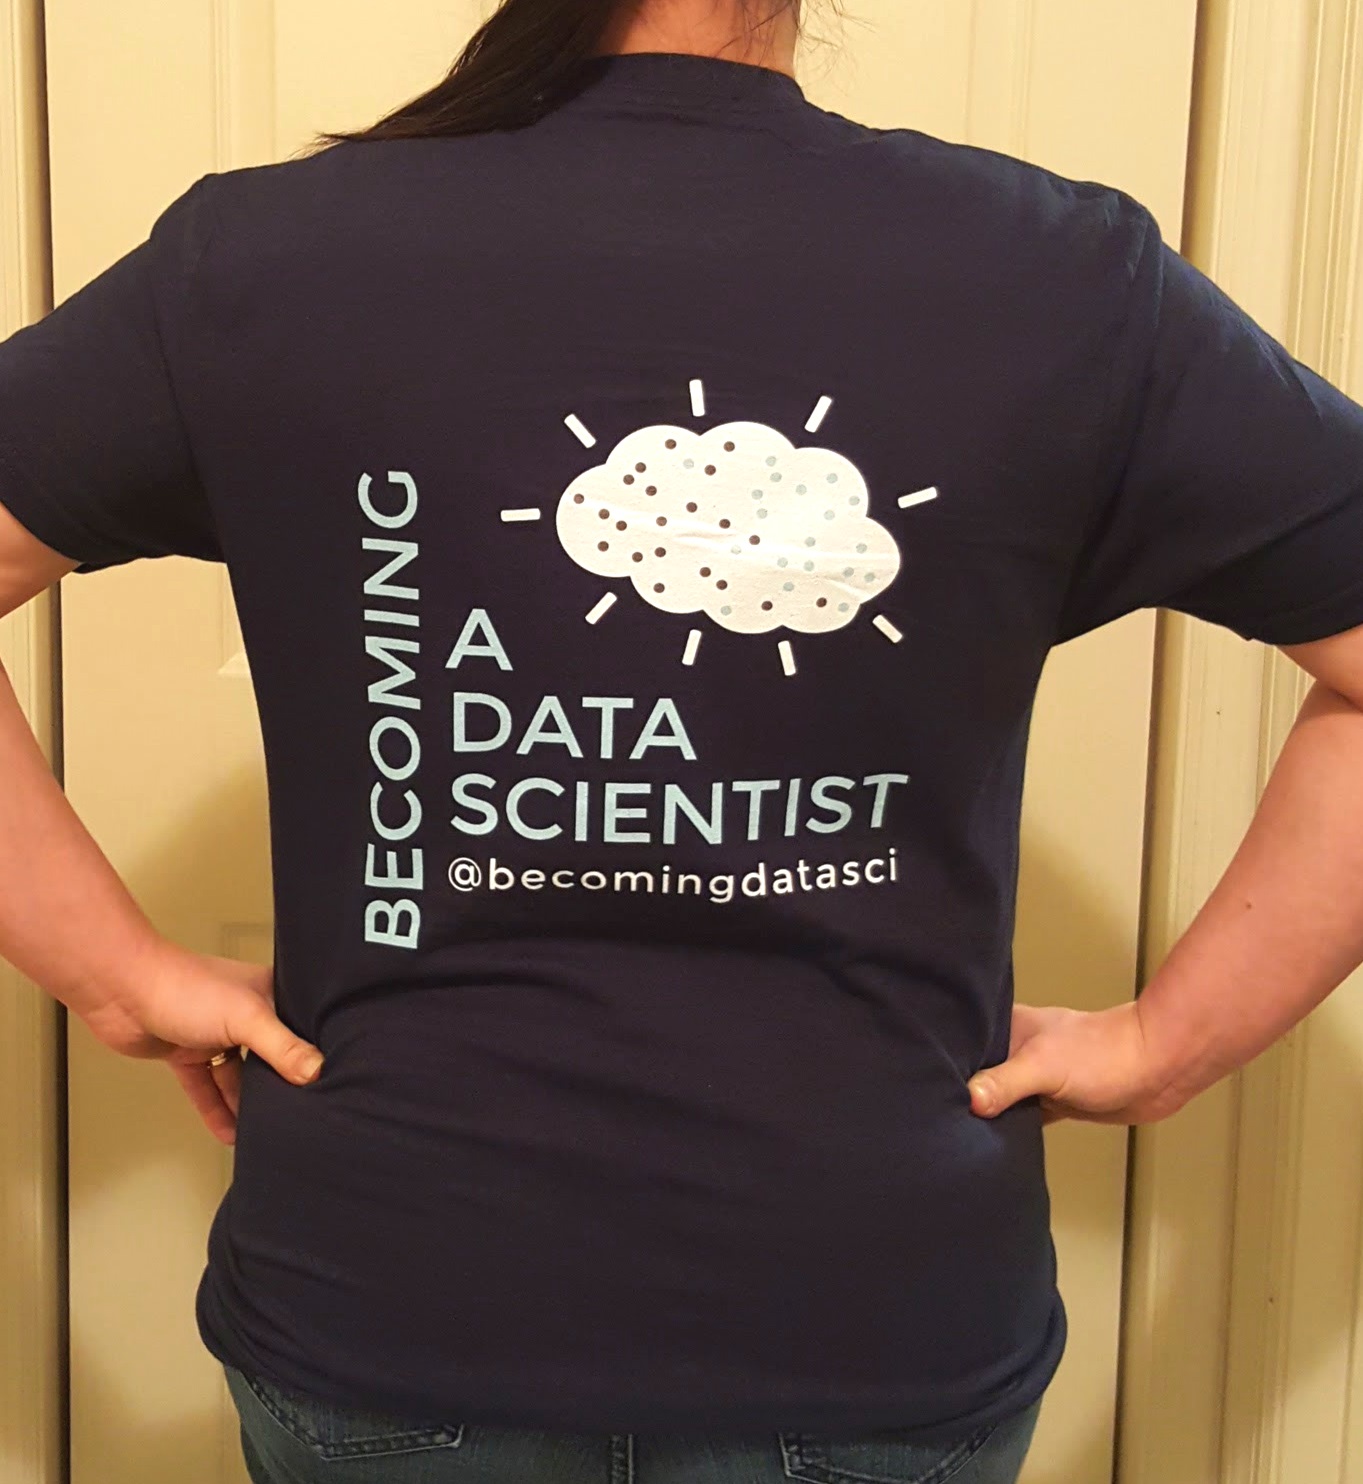
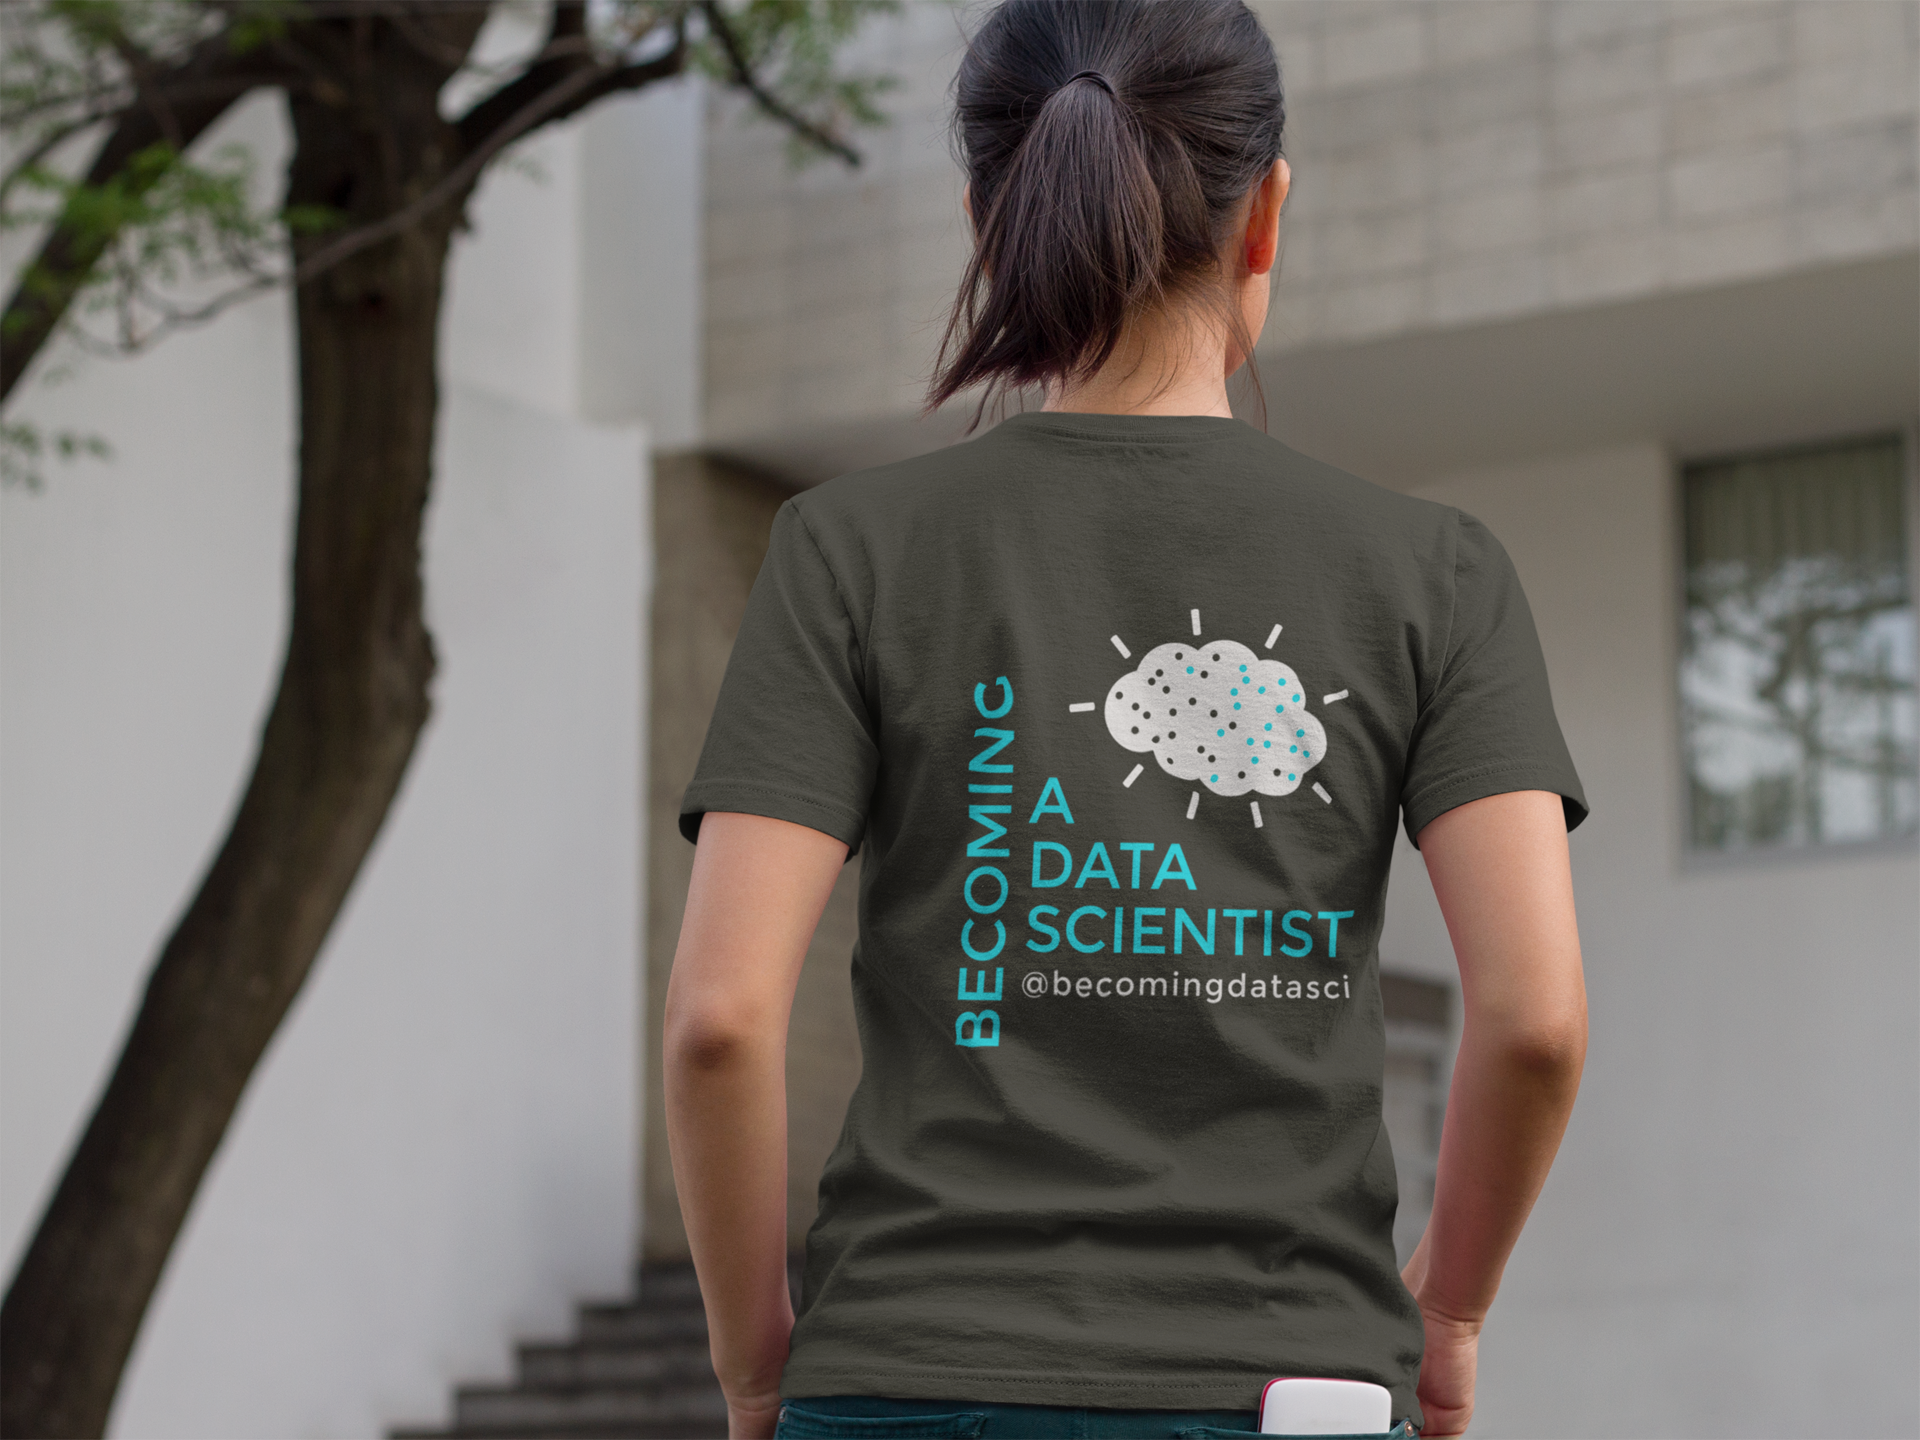
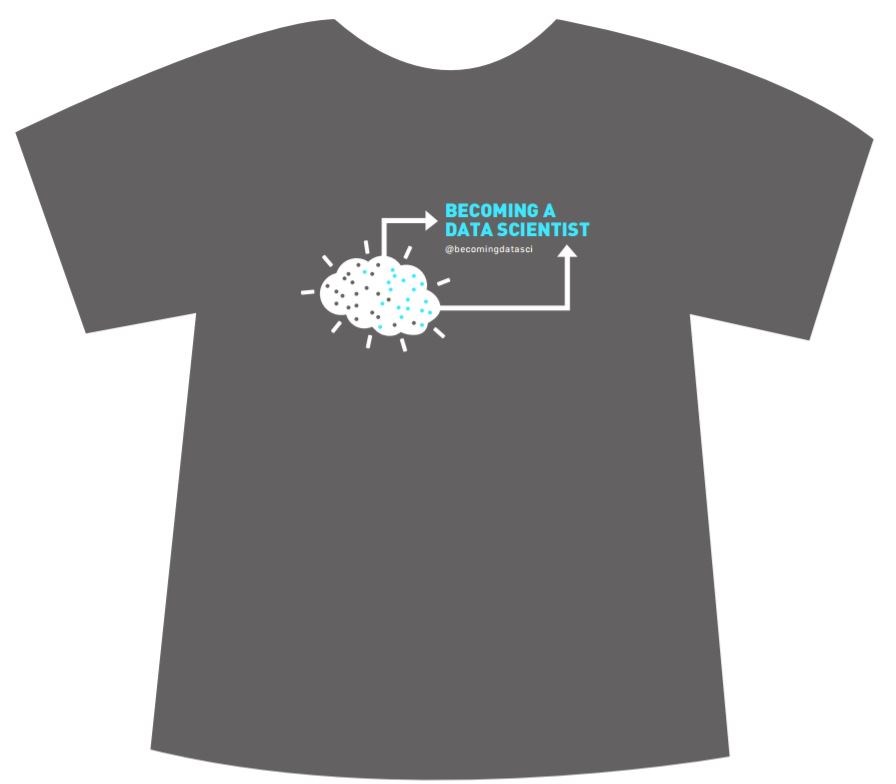
Here are photos of me wearing the shirt, but this was before I made the front design slightly smaller (so it doesn’t wrap into armpit), and I moved the back design slightly higher and also made the gray dots (data points?) transparent so the color of the shirt will show through there now (see store images above for current design). You can see that the teal came out as a lighter blue in printing. This is the “Premium Tee” style in “New Navy”.
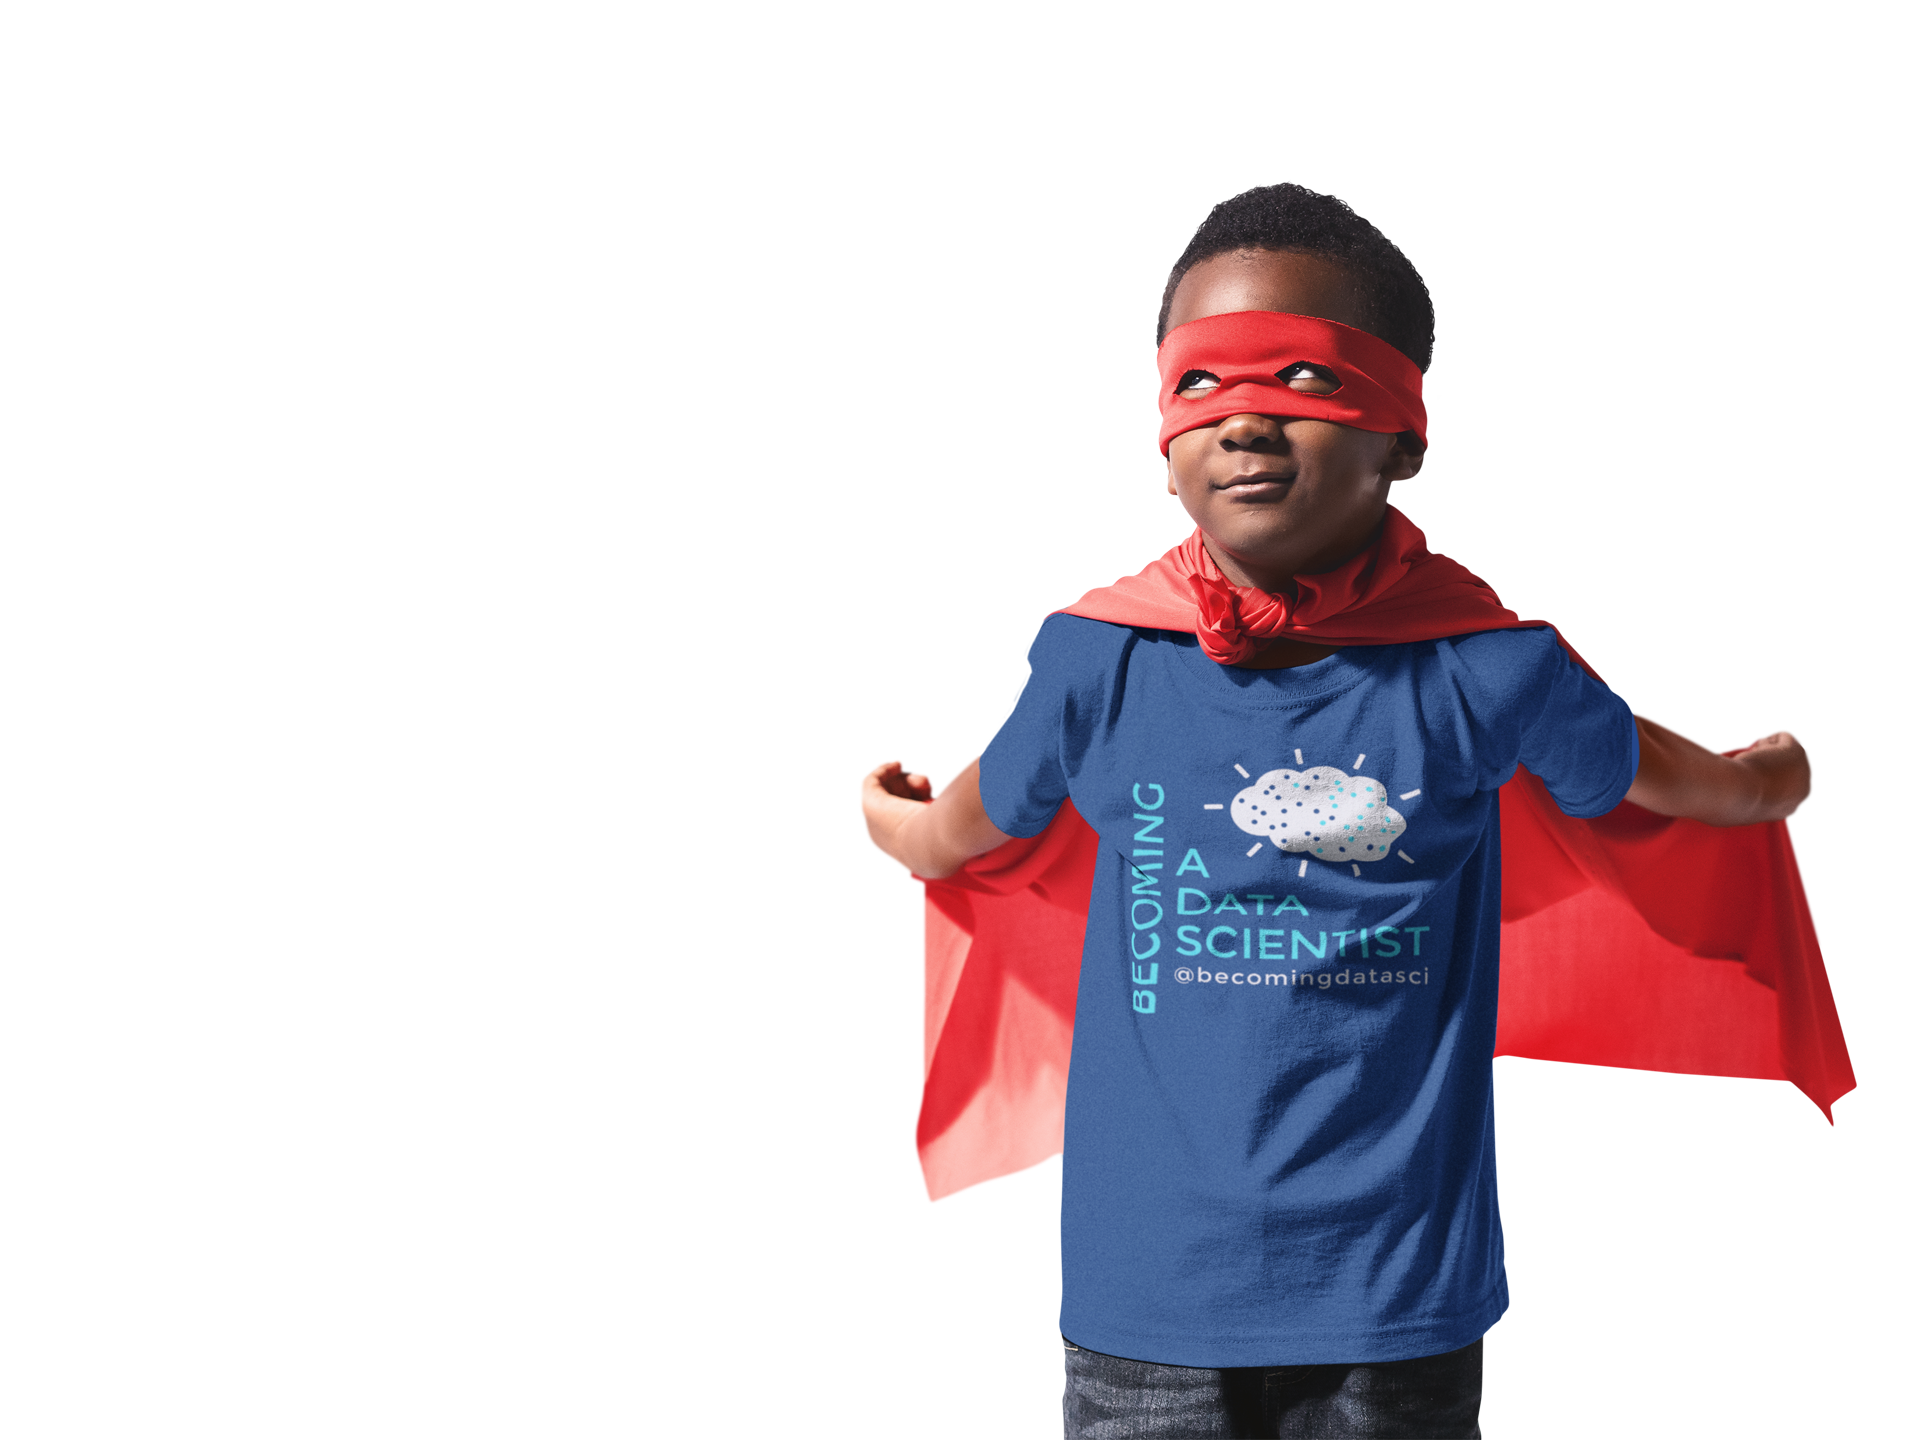
Here’s a model wearing a simulated version of the shirt.
Order yours here, with Free Shipping Until March 1!
 ]]>
]]>David Meza is Chief Knowledge Architect at NASA, and talks to Renee in this episode about his educational background, his early work at NASA, and examples of his work with multidisciplinary teams. He also describes a project involving a graph database that improved search capabilities so NASA engineers could more easily find "lessons learned".
Podcast Audio Links: Link to podcast Episode 15 audio Podcast's RSS feed for podcast subscription apps]]>
David Meza is Chief Knowledge Architect at NASA, and talks to Renee in this episode about his educational background, his early work at NASA, and examples of his work with multidisciplinary teams. He also describes a project involving a graph database that improved search capabilities so NASA engineers could more easily find “lessons learned”.
Podcast Audio Links:
Link to podcast Episode 15 audio
Podcast’s RSS feed for podcast subscription apps
Podcast on Stitcher
Podcast on iTunes
Podcast Video Playlist:
Youtube playlist of interview videos
More about the Data Science Learning Club:
Data Science Learning Club Welcome Message
Data Science Learning Club Activity 15 – Explain an Analysis (Communication)
Data Science Learning Club Meet & Greet
Mentioned in the episode:
NASA Knowledge (@NASAKnowledge on twitter)
Engineering Management
Knowledge Management
Organizational Learning
Knowledge Engineering
Information Architecture
Data Analysis
Neo4j
Elasticsearch
IHS Goldfire
MongoDB
@davidmeza1 on Twitter
David Meza on LinkedIN
Southern Data Science Conference in Atlanta, GA on April 7, 2017 (Coupon code RENEE takes 15% off ticket price)
]]>Without further ado, the top 3 vote-winners after 94 votes, in no particular order, are….
1) Ryne
Ryne is an analyst for an economic consulting firm in Salt Lake City looking to transition to a career in data science. Lucky for him, his wife Alexis is a graphic designer and entered the competition in his name so he could win a book! She had a baby a few months ago and is just doing freelance design as time permits.
Alexis’ website is alexisbrittany.com. (Feel free to reach out if you need a designer!)
2) Amarendra
Amarendra (Amar) has recently moved to Philadelphia to pursue an MS in Business Intelligence and Analytics at Saint Joseph’s University. He believes in continuous learning and aspires to contribute to the field of data exploration. Upon graduation, Amar would like to work in the field of data visualization. He loves working with tableau and one of his resolutions for 2017 is to get appreciated by one of the Tableau Zen Masters.
3) coming soon
I’ll update here as soon as I hear back from the 3rd finalist! If I don’t hear back, I may give the prizes to the 4th place winner.
Amar and Ryne both selected the same data science book, so I thought I’d share that here for others that may be interested. They will both be receiving The Python Data Science Handbook by Jake VanderPlas:

You will hear about the final design soon, as well as options for purchasing t-shirts! Thanks to everyone who entered and voted!
]]>In this first episode of "Season 2" of Becoming a Data Scientist podcast, we meet Jasmine Dumas, a new data scientist who tells us about going from biomedical engineering into a data science project experience and then finding her first job as a data scientist.
Podcast Audio Links: Link to podcast Episode 14 audio Podcast's RSS feed for podcast subscription apps]]>
In this first episode of “Season 2” of Becoming a Data Scientist podcast, we meet Jasmine Dumas, a new data scientist who tells us about going from biomedical engineering into a data science project experience and then finding her first job as a data scientist.
Podcast Audio Links:
Link to podcast Episode 14 audio
Podcast’s RSS feed for podcast subscription apps
Podcast on Stitcher
Podcast on iTunes
Podcast Video Playlist:
Youtube playlist of interview videos
More about the Data Science Learning Club:
Data Science Learning Club Welcome Message
Activity 14: Hidden Markov Models
Activity 15: Neural Nets for Text
Data Science Learning Club Meet & Greet
Mentioned in the episode:
Hadley Wickham’s Advanced R book
shinyGEO: a web-based application for analyzing gene expression omnibus datasets
]]>For the ones that aren’t t-shirt-print-ready, I’ll get a graphic designer to tidy them up, so don’t worry about whether they’re printable when you vote. We can also vary colors and things like that later. Just pick the design you like!
click the images for larger views
dsnmizan
Venkat
Gordon
Kumar
Nigel
Ridhima
Ryne
Amarendra
––> VOTE HERE <––
Thanks to my generous Patreon supporters, I can hire someone to help me out 8-20 hours per month, paying $15/hr. More info and application form at this link.
Please let me know if you have any questions or if there are any problems with the form. Email me at renee@becomingadatascientist.com or tweet me at @becomingdatasci.
I look forward to reading the applications!!
]]>You can stream or download the audio at this link (download by right-clicking on the player and choosing “Save As”), or listen to it in podcast players like iTunes and Stitcher. Enjoy!
Show Notes:
The White House Names Dr. Ed Felten as Deputy U.S. Chief Technology Officer
Edward W. Felten at Princeton University
Dr. Edward Felten on Wikipedia
White House Office of Science and Technology Policy (OSTP)
The Administration’s Report on the Future of Artificial Intelligence (White House Report from October 2016)
Artificial Intelligence, Automation, and the Economy (White House Report from December 2016)
Ed Felten on Twitter: Official / Personal
———
Other Podcasts in this Government Data Series:
- Partially Derivative White House Special – with DJ Patil, US Chief Data Scientist
- Not So Standard Deviations – Standards are Like Toothbrushes – with with Daniel Morgan, Chief Data Officer for the U.S. Department of Transportation and Terah Lyons, Policy Advisor to the Chief Technology Officer of the U.S.
- Linear Digressions – Data + Healthcare + Government = The Future of Medicine – with Precision Medicine Initiative researcher Matt Might
- More to Come!
I outlined my whole plan here on my Patreon Campaign. You’ll see a new page on this site soon acknowledging supporters, and I’ll update you on the progress.
Whether you can give financially, or even if you just share the campaign with your data science friends, you are helping Becoming a Data Scientist podcast, the learning club, Data Sci Guide, Jobs for New Data Scientists, and all of my websites get off the ground! Thank you!!

Here are the rules/guidelines for entry:
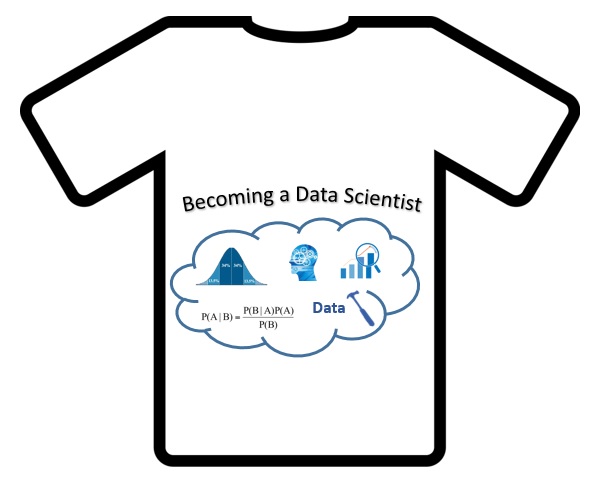
1. Create a design that prominently says “Becoming a Data Scientist” and can be easily scaled to fit in on the front or back of a t-shirt. If you create a design for the back, also create a small “pocket sized” text or design for the front of the shirt. But I don’t have a preference – front or back of shirt designs are both fine!
If it can be incorporated into the design without looking too cluttered, you can also add “Podcast and Learning Club” and/or “@becomingdatasci”, but that is not a requirement.
The design can be just text, text with an image, more abstract, use your imagination! As long as “Becoming a Data Scientist” is clearly readable, your design will be considered. Obviously, vulgar designs will not be considered, and I’ll also remove them (or anything spammy) from the comments on this post.
Please don’t use more than 2 colors in your design itself, as more can be cost-prohibitive. The background color can be a different 3rd color.
Here is a site with some guidance for preparing a design for t-shirts: https://gomedia.com/zine/tutorials/pro-tips-preparing-artwork-t-shirt-printing/
(Note – I don’t expect the design to be complex or super-artistic, and a text-only design could be created in a simple text or image editor!)
You can even use an online shirt design program like CustomInk, as long as the design can be extracted for use at another printing site (I’m not sure what the rules or capabilities of most of those t-shirt design websites are).
2. Please submit 2 files: your design itself (in a format that can be read on multiple platforms, like a PDF), large enough that it can be zoomed in to “life size”, and then also a smaller image of your design as you imagine it on a shirt – choose a shirt color and location for your design and create a little “shirt preview” image I can share with readers for the vote (this one doesn’t have to be zoomable to full size – the largest size I’d post it at is about 500×500). Please let me know if you have any questions or suggestions about this!
You can submit the files by posting a comment below. Don’t put your email in the text of the comment, I’ll be able to see it behind the scenes from the form. Make sure to include your name (it can be just your first name if you want) as you want it shared along with your design if you get selected for the voting round, along with the links to the 2 files and any link you want to point people to – your blog, your portfolio, your twitter account, etc.
UPDATE 12/5/2016: It looks like I made the turnaround time short (I’d like to have at least 10 designs before the voting), and I know some people may have great ideas but not great graphic design skills, so I’m making 2 changes:
- It doesn’t need to be a “print-ready” design. If you sketch it out and your design wins, I’ll get a graphic designer to help turn it into a file to send to the t-shirt printer
- The deadline is now extended to the end of the calendar year (see below)
Thank you to those of you who have entered already!!
Here’s how the contest will go:
I’ll accept entries until 11:59pm Saturday, December 31, 2016. Over the next week, depending on how many entries there are, I’ll narrow down the selection to maybe 5-10 choices. I’ll create a blog post with the t-shirt images and names of the designers, with a way to vote on your favorite, and advertise it on @becomingdatasci to get as many votes as possible.
The top 3 vote-winners will win:
- A t-shirt
- A data science related book of their choice up to $60
- Will be featured in a “finalists” blog post with their design, a little blurb about them, and a link to their website
- A tweet with their design and a link to their site on my @becomingdatasci twitter account.
From the finalists, I’ll choose my favorite to be printed. The final winner will also get:
- 2-3 extra t-shirts with their design to give out to friends
- Name credited as designer wherever the t-shirt is sold
- Additional tweets with their design announced as the winner, with a link to their site, on @becomingdatasci.
- A shout-out on the Becoming a Data Scientist podcast
Please let me know if there’s anything I forgot to detail here or if you have any questions! I look forward to seeing the submitted designs!!
Update: I should probably mention that any proceeds from sales of the shirts will go to support the maintenance and creation of more content at this site BecomingADataScientist.com, the podcast, the Data Science Learning Club, DataSciGuide, and my other data science sites and social media accounts. I’ll be posting a Patreon campaign soon to raise money to hire help to keep these sites updated, and money I earn from selling t-shirts will go toward that as well.
]]>Episode Audio (mp3) – also available on iTunes, Stitcher, etc.
(note, there is no video for this episode)
On the panel:
]]>The talk was recorded and video should be out within a few weeks!
Here are the slides: Becoming a Data Scientist – Advice from my Podcast Guests
and the slide notes.
Update 10/26: Here is the recording of my talk, with a playlist of other talks from PyData DC!
]]>95% of the 158 respondents who gave answers about their jobs follow at least one of my twitter accounts, so you can think of these results as representing my twitter followers.
I’m mostly going to let the tables and graphs speak for themselves. There’s a lot to unpack in the survey (over 50 questions), and a ton of ways to slice and dice it. Because I wanted to show various breakdowns, I did this in simple Excel pivot tables and didn’t spend a ton of time formatting (I know they’re kinda ugly – sorry).
If any of the tables or charts below are particularly hard to understand, please let me know and I’ll annotate further or improve! Click to view full-size.
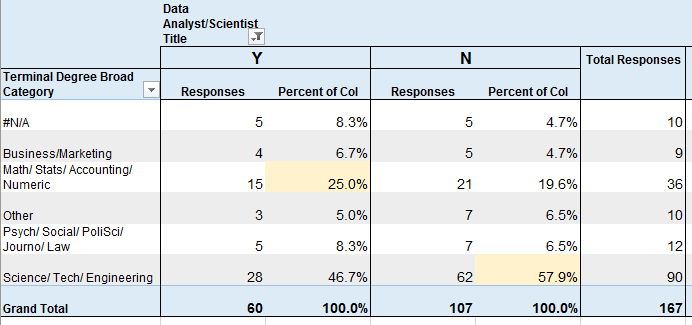
Educational Field
vs Job Title of Data Analyst or Data Scientist (yes/no)
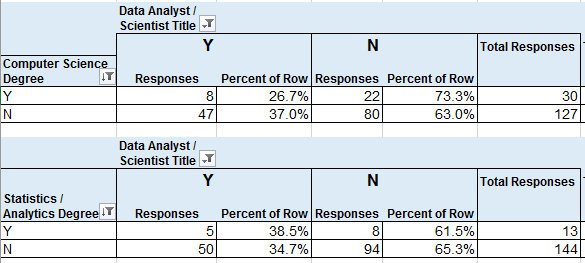
Computer Scientist or Data Sci / Statistics / Analytics Degree
vs Job Title of Data Analyst or Data Scientist (yes/no)
30 (19%) of respondents had CS degrees, which was the most common degree name, and 27% of them had a job title that I categorized under Data Analyst or Data Scientist.
8.3% of respondents had Data Science, Statistics, or Analytics degrees, and 38.5% of them had job titles that I categorized as Data Analyst/Scientist.
Educational Level
vs Considers Self Data Scientist (No/Not Yet or Yes)
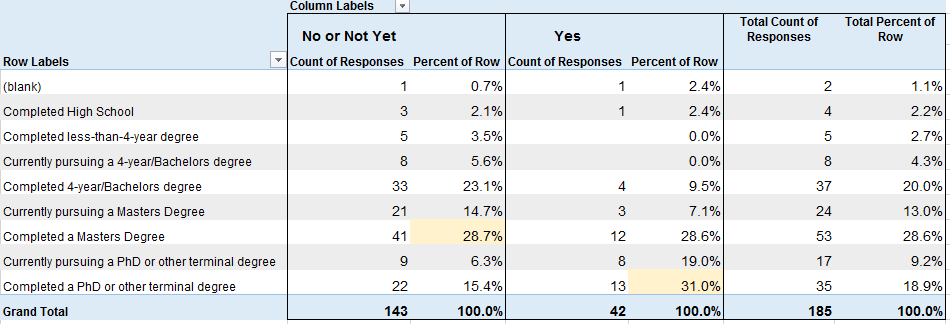
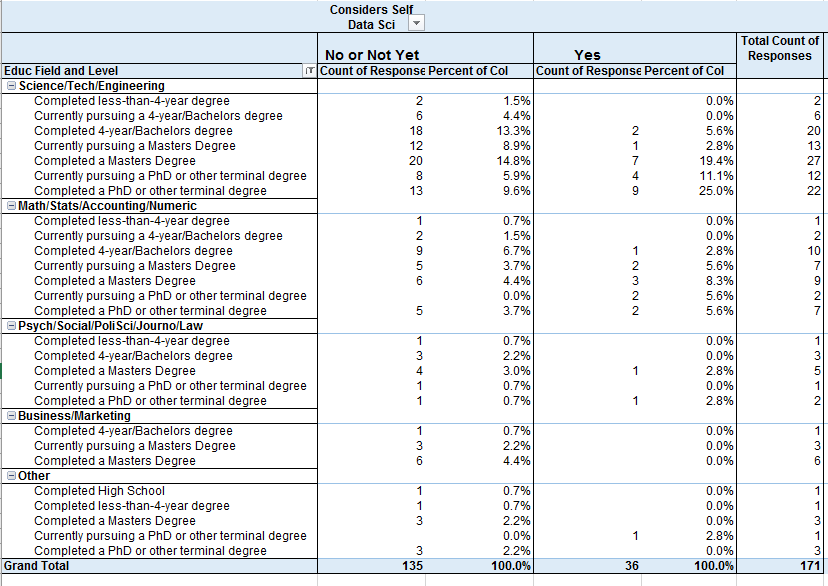
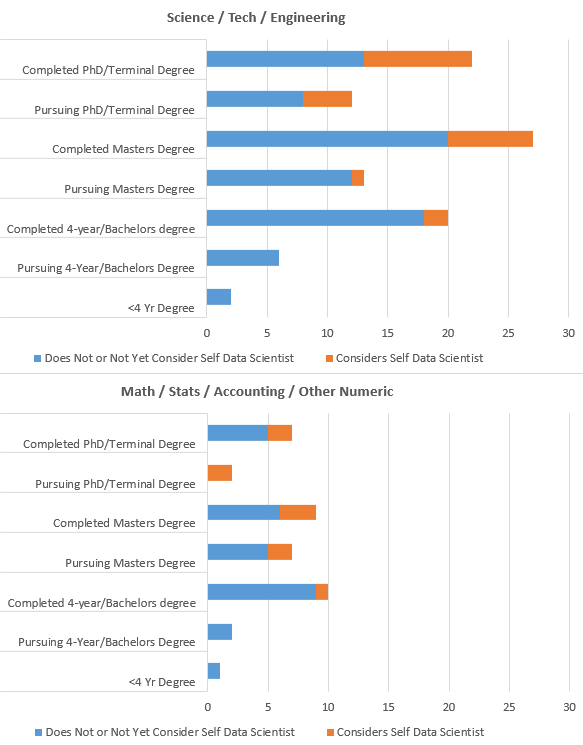
Considers Self Data Scientist by Educational Level and Field
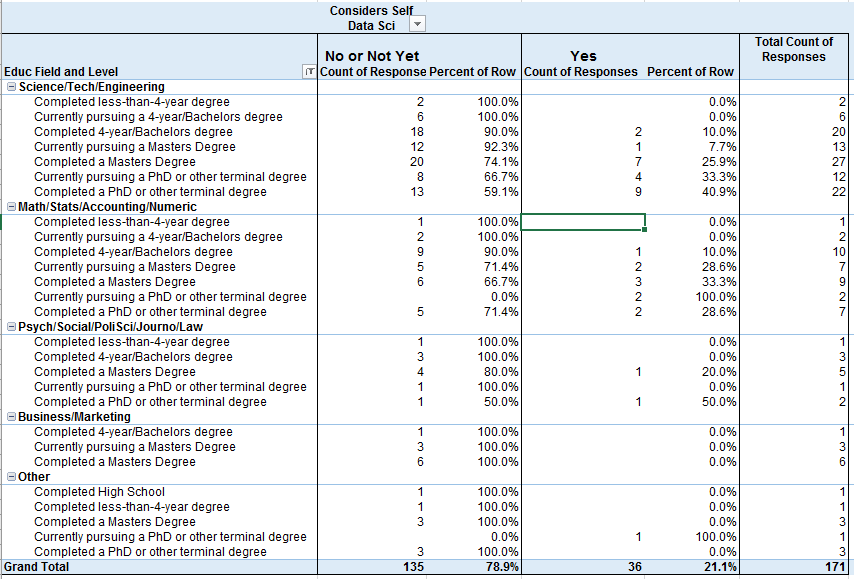
Educational Field by Considers Self Data Scientist
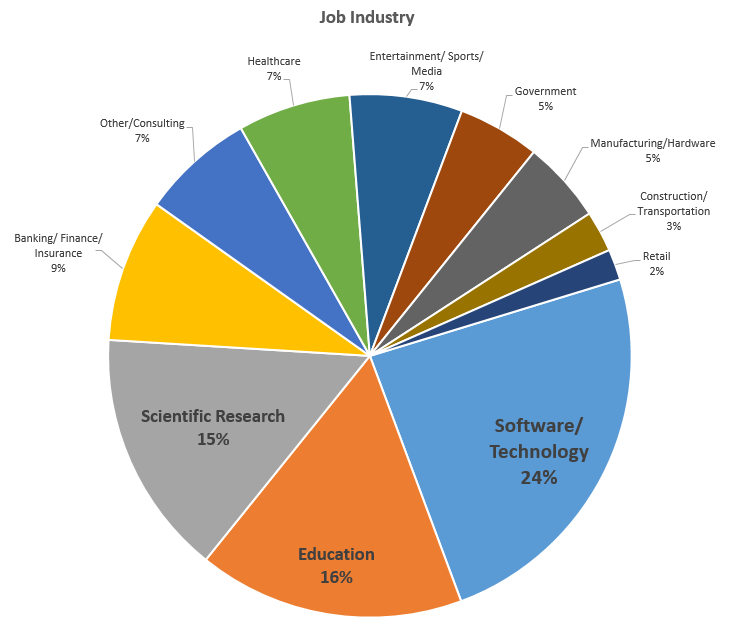
Respondent Breakdown by Job Industry
Visual of those with Science/Tech/Eng Degrees and Math/Stats/Acctg Degrees
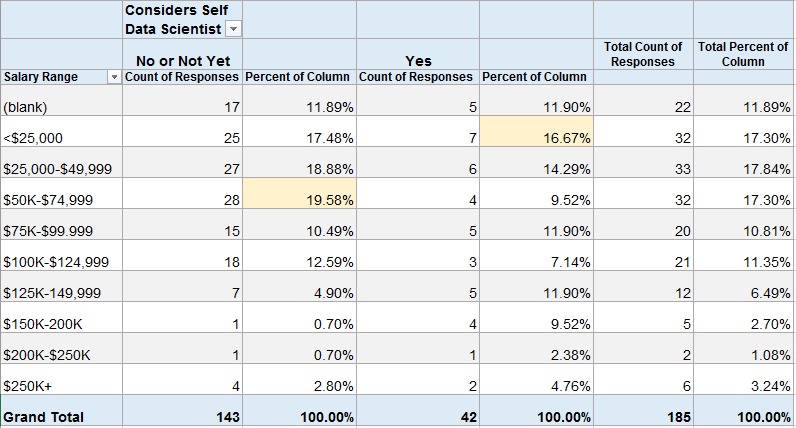
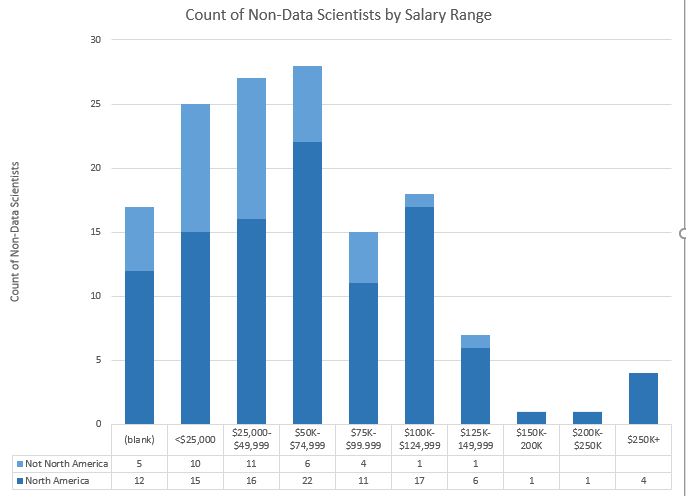
Percentage of Respondents by “Considers Self Data Scientist” with each Salary Range
About 20% (28) of those that do not consider themselves to be Data Scientists make $50-75K. About 17% (7) of those that do consider themselves to be Data Scientists make under $25K.
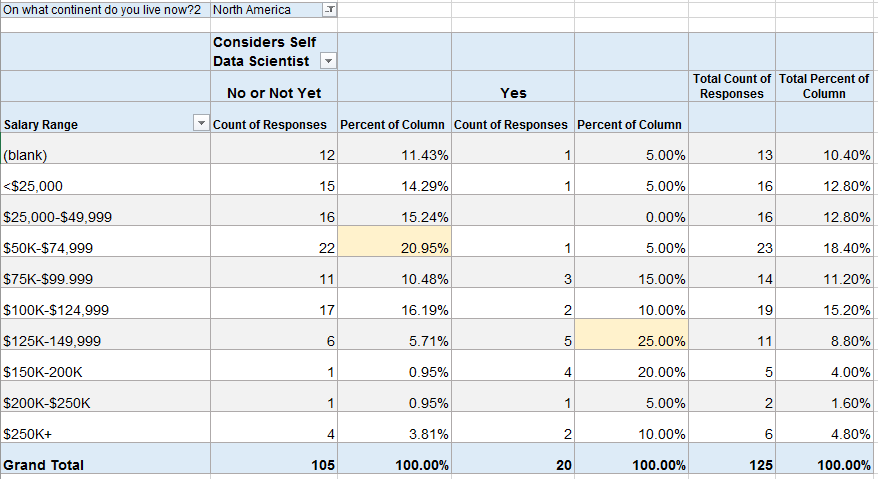
Because the numbers above looked surprising to me, I filtered the same table to those in North America (assuming that many of the low-salary data scientists might be outside of the U.S.).
In North America, about 21% (22) of those that do not consider themselves to be Data Scientists make $50-75K. But now 25% (5) of those that do consider themselves to be Data Scientists make $125-150K. This also shows that 22 of the 42 people above (52%) that considered themselves Data Scientists live outside of North America.
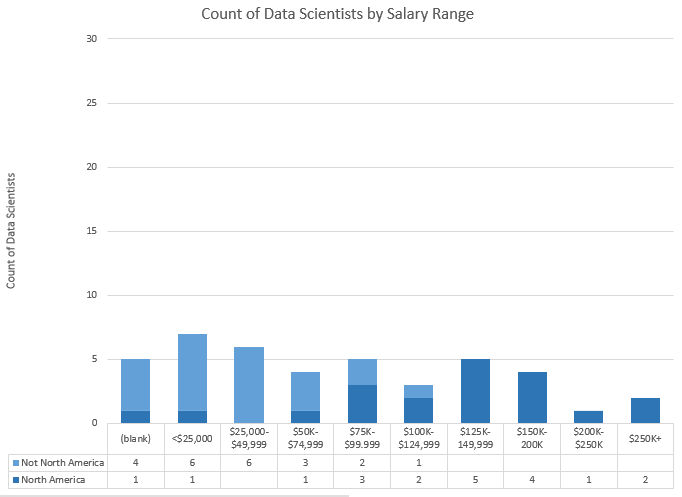
Bar Charts of Above Data. Top = Data Scientists, Bottom = Not Data Scientists.
I may release some of this data at the end of my analysis. If you’re interested in diving in yourself, let me know in the comments and I’ll work on it for a future post.
More results on the way in the near future! Next up, how many respondents follow each twitter account and whether more people watch or listen to the podcast!
]]>
Becoming a Data Scientist Podcast Interviews YouTube Playlist
or listen to/download the full audio episodes via the blog. Here are the links to the blog posts (with links to everything else), and the audio itself for those first four episodes:
Episode 0: Renee Teate (me) and intro to the podcast
Audio Only (with MP3 download link)
Episode 1: Will Kurt – English/Library Science to Data Science
Audio Only (with MP3 download link)
Episode 2: Safia Abdalla – College Student, Conference Speaker, Python/Jupyter Contributor
Audio Only (with MP3 download link)
Episode 3: Shlomo Argamon – Director of Master of Data Science program at IIT
Audio Only (with MP3 download link)
Click through to any episode for links to the RSS subscription feeds, links to the learning club activities, etc.
Enjoy!
]]>Please fill out the survey and share it with your friends and followers on social media! The survey is a little long/detailed, but most of it is optional. I value your opinions! Thank you so much for participating!!
]]>tl;dr: Boosting ensemble algorithms in Machine Learning use an approach that is similar to assembling a diverse team with a variety of strengths and experiences. If machines make better decisions by combining a bunch of “less qualified opinions” vs “asking one expert”, then maybe people would, too.
Why is this post on this blog?
I’ve been thinking a lot about diversity in tech lately. After the #FBNoExcuses conversations on twitter, I was motivated to start UntappedPipeline.com (on twitter:@untappdpipeline) because I know so many awesome women and people of color in tech, and it amazes me that some companies seem to think they are so rare and hard to find (hence using the “pipeline problem” as an excuse for not having a diverse workforce).
Of course, “diversity” can mean a lot of things: gender diversity, racial/ethnic diversity, diversity of educational backgrounds, etc. – but it all really comes down to diversity of culture/thoughts. If you are interested in learning more about diversity in tech and the benefits of hiring diverse teams, check out the Resources page on UntappedPipeline.com. Here’s one study in particular that highlights the economic benefits of a diverse tech workforce: Decoding Diversity (Dalberg/Intel, PDF).
So if this post is about diversity, why am I writing it on my “Becoming a Data Scientist” blog instead of at Untapped Pipeline? Because I’ve been doing some machine learning lately that I just realized is a great metaphor for the benefits of hiring diverse teams, and this is also an opportunity to explain a data science concept. Additionally, I’ve been talking about data science teams for a long time, and one of my motivations for starting the Becoming a Data Scientist podcast was to feature the many paths people take to data science, because data science in itself is an interdisciplinary job that requires a variety (diversity) of experience: primarily in statistics, computer programming, and “business” (or domain knowledge), but really there is a very broad set of skills that come into play when doing data science, and no one has them all (relevant rant by @quominus). I will list some references about building Data Science teams at the end of the post.
There are two machine learning algorithms I’ve used recently that illustrate the specific “ensemble learning” concept I want to focus on: Random Forest and Gradient Boosting Classifiers.
Random Forest
A Random Forest Classifier works like this: You may have heard of Decision Trees, which are pretty much just “if then” classifiers that end up generating a set of rules: “If Attribute 1 is in this range of values, and Attribute 2 is this boolean value, and Attribute 3 is greater than this value, then out of all of the possible results, this one is most likely.” Every example you feed into it will drop into one of the possible outcomes, with a certain probability of being correct. The article “A Visual Introduction to Machine Learning” has a great animated illustration of how decision trees work.
What a Random Forest does is build up a whole bunch of “dumb” decision trees by only analyzing a subset of the data at a time. A limited set of features (columns) from a portion of the overall records (rows) is used to generate each decision tree, and the “depth” of the tree (and/or size of the “leaves”, the number of examples that fall into each final bin) is limited as well. So the trees in the model are “trained” with only a portion of the available data and therefore don’t indivisually generate very accurate classifications.
However, it turns out that when you combine the results of a bunch of these “dumb” trees (also known as “weak learners”), the combined result is usually even better than the most finely-tuned single full decision tree. (So you can see how the algorithm got its name – a whole bunch of small trees, somewhat randomly generated, but used in combination is a random forest!)
When you combine multiple methods to determine a result in machine learning, it is called ensemble learning. In particular, when you use a bunch of weak learners and combine them by having them vote on the outcome (whichever outcome occurs most often for a particular record wins), iteratively improve the outcome, or average the results in some way to create a result that is stronger than any single-pass approach, that is called boosting.
Gradient Boosting
Another type of boosting is called Gradient Boosting. The approach is actually very similar to the Random Forest algorithm, except (as far as I understand it), it uses a type of optimization called Gradient Descent, which minimizes a loss function. Basically, each time it generates a decision tree, it’s using what it learned the last time it generated one to make the next one a little less bad (reducing cost/loss).
I’m not going to go to far into the technical details here, partially because that’s not really the point of this article, and partly because I start having flashbacks to my Optimization class in grad school, which was not a happy experience.
There are other boosting algorithms like Adaptive Boosting (AdaBoost) and other ensemble methods in machine learning to explore. Some of them are described in the scikit-learn (machine learning python package) documentation if you want to learn more.
So back to my original point
Now that I have the explanations out of the way, I can get back to the point I wanted to make. Notice how these algorithms work. Each “weak learner” only has some of the information needed to make a good guess to classify something. In fact, they’re often incorrect on their own, because they just don’t have the experience that a big “solo” algorithm has with the data. (Imagine a bunch of weird-looking small trees vs one big gorgeous well-developed oak tree.) However, when you combine the wide variety of partial experiences that the “weak learners” provide, their combined guess turns out to actually be better than the guess made by the one big fully-formed tree.

So, think of the same concept for building a Data Science Team. There is currently a shortage of “experts” in data science, and most companies don’t seem to know what kind of data scientist they need anyway. Some companies are lamenting the lack of “qualified” data scientists (i.e. “unicorns” that have all of the necessary skills and experience already), while in the meantime, there are plenty of business analysts, software developers, UX designers, subject matter experts, people that do similar work in other fields (like biotechnology, cognitive science, etc etc etc), and people that are on their way to becoming data scientists and only have a portion of the requisite skills and knowledge. Some companies are just “pattern matching” and trying to hire people that are exactly like their existing successful employees (though it’s unlikely they have even defined what they mean by “successful employees”).
However, if you know how to find creative and motivated “go-getters” that want to learn on the job and contribute to a team, and each person on the team has a portion of the needed experience and skills, there is a good chance that in combination (if given good support and resources!) that a small group of “junior data scientists with other relevant skills” will actually turn out better than hiring one or two “experts” in the first place. Plus, they cost less. Plus, they are likely very trainable. Plus, they really want to make a difference and prove themselves as capable data scientists.
Anyway, I’m making a lot of generalizations here, and need to go back and fill in some of my comments in this last section with references, but you can see what I’m getting at. For those in tech that have a really hard time believing that that “scrappy new business analyst” with a non-terminal non-computer-science degree from a non-ivy-league school that doesn’t have many years of experience doing the exact kind of work you want them to do at your company won’t be “qualified” to fill a Data Science position, maybe it will help to think of the problem as one that Boosting will solve. Create an “ensemble” of “learners” that may individually only have a subset of the experience and may be self-taught and not do everything the “right” way when tasked to do it alone, but can each contribute their wide variety of experiences and skills to come up with a final solution as a team. I’m willing to bet that the solutions generated by a diverse group with less-than-ideal credentials (but a wider breadth of experience) will turn out better than what an “expert” (or homogenous group) would come up with on their own anyway, because the research shows that it usually does. Just do the math.
[more links about building data science teams to be added]
]]>In this interview, we meet physicist Debbie Berebichez, who you might recognize from her TEDx talks, her appearances in Discovery Channel’s Outrageous Acts of Science and other TV shows! Debbie grew up in Mexico City and was discouraged by her family and teachers from studying science, but later went on to become the first Mexican woman to get a PhD in physics from Stanford, and is now Chief Data Scientist at Metis Data Science Bootcamp in New York. Podcast Audio Links: Link to podcast Episode 13 audio Podcast's RSS feed for podcast subscription apps]]>
In this interview, we meet physicist Debbie Berebichez, who you might recognize from her TEDx talks, her appearances in Discovery Channel’s Outrageous Acts of Science and other TV shows! Debbie grew up in Mexico City and was discouraged by her family and teachers from studying science, but later went on to become the first Mexican woman to get a PhD in physics from Stanford, and is now Chief Data Scientist at Metis Data Science Bootcamp in New York.
Podcast Audio Links:
Link to podcast Episode 13 audio
Podcast’s RSS feed for podcast subscription apps
Podcast on Stitcher
Podcast on iTunes
Podcast Video Playlist:
Youtube playlist of interview videos
More about the Data Science Learning Club:
Data Science Learning Club Welcome Message
Learning Club Activity 13: Show & Tell
Data Science Learning Club Meet & Greet
Links to topics mentioned by Debbie in the interview:
Metis Data Science Training
[more coming soon]
Verena, David, Kerry, and Anthony are members of the Becoming a Data Scientist Podcast Data Science Learning Club! They appear in the order in which they joined the club, and each discuss their starting points before joining, their participation in the activities, and advice they have for new data science learners. Podcast Audio Links: Link to podcast Episode 12 audio Podcast's RSS feed for podcast subscription apps Podcast on Stitcher Podcast on iTunes Podcast Video Playlist: Youtube playlist of interview videos More about the Data Science Learning Club: Data Science Learning Club Welcome Message]]>
Verena, David, Kerry, and Anthony are members of the Becoming a Data Scientist Podcast Data Science Learning Club! They appear in the order in which they joined the club, and each discuss their starting points before joining, their participation in the activities, and advice they have for new data science learners.
Podcast Audio Links:
Link to podcast Episode 12 audio
Podcast’s RSS feed for podcast subscription apps
Podcast on Stitcher
Podcast on iTunes
Podcast Video Playlist:
Youtube playlist of interview videos
More about the Data Science Learning Club:
Data Science Learning Club Welcome Message
Data Science Learning Club Meet & Greet
1) Verena Haunschmid
Data Science Learning Club Activity 07: Linear Regression
Verena’s Results for Linear Regression on Salary Dataset


Verena’s website
@ExpectAPatronum on Twitter
2) David Asboth
City University London Msc Data Science
Data Science Learning Club Activity 02: Creating Visuals for Exploratory Data Analysis
David’s results exploring London Underground data
Data Science Learning Club Activity 07: K-Means Clustering
David’s results using k-means to draw puppies in 3 colors
FlyLady (the house cleaning system I mentioned)
David’s website
@davidasboth on Twitter
3) Kerry Benjamin
Data Science Learning Club Activity 01: Find, Import, and Explore a Dataset
Kerry’s results for Activity 1 IGN Game Review Data exploration
Data Science Learning Club Activity 02: Creating Visuals for Exploratory Data Analysis
Kerry’s Blog Post about Activity 02 – “My First Data Set Part 2: The Fun Stuff”
Blog post about Data Camp – “The Data Science Journey Begins”
Kerry’s blog post “Getting Started in Data Science: A Beginner’s Perspective”
Kerry’s Blog “The Data Logs”
@kerry_benjamin1 on Twitter
4) Anthony Peña
molecular biology
biotechnology
Data Science Learning Club Activity 07: K-Means Clustering
Anthony’s results for Activity 07
Stephanie Rivera has worked in machine learning and data science for academic research (at University of Tennessee), for the government (Department of Defense), for a large consulting firm (Booz Allen), and now for a startup (MyStrength). In the interview, she discusses her career path, her experiences with mentorship, and her role in authoring The Field Guide to Data Science and the Explore Data Science online course. Podcast Audio Links: Link to podcast Episode 11 audio Podcast's RSS feed for podcast subscription apps Podcast on Stitcher Podcast on iTunes Podcast Video Playlist: Youtube playlist of interview videos]]>
Stephanie Rivera has worked in machine learning and data science for academic research (at University of Tennessee), for the government (Department of Defense), for a large consulting firm (Booz Allen), and now for a startup (MyStrength). In the interview, she discusses her career path, her experiences with mentorship, and her role in authoring The Field Guide to Data Science and the Explore Data Science online course.
Podcast Audio Links:
Link to podcast Episode 11 audio
Podcast’s RSS feed for podcast subscription apps
Podcast on Stitcher
Podcast on iTunes
Podcast Video Playlist:
Youtube playlist of interview videos
More about the Data Science Learning Club:
Data Science Learning Club Welcome Message
[learning club activity coming soon]
Data Science Learning Club Meet & Greet
Links to topics mentioned by Stephanie in the interview:
Total Domination in Graph Theory (pdf)
Some research publications by Stephanie:
Machines Watch you Surf the Web
Total domination dot-stable graphs
The University of Tennessee Knoxville Center for Intelligent Systems and Machine Learning (CISML)
UTK Distributed Intelligence Laboratory
UTK Infant Perception Action Laboratory
Natural Language Processing (NLP)
Explore Data Science (now via Metis)
]]>Trey Causey is a data scientist with a background in psychology and sociology who, like Renee, is from Virginia. He has worked as a data scientist at a range of companies from zulily to ChefSteps, and has also developed some interesting sports analytics projects, including the New York Times 4th Down bot. Trey also has advice for people wanting to start a career in data science. Podcast Audio Links: Link to podcast Episode 10 audio]]>
Trey Causey is a data scientist with a background in psychology and sociology who, like Renee, is from Virginia. He has worked as a data scientist at a range of companies from zulily to ChefSteps, and has also developed some interesting sports analytics projects, including the New York Times 4th Down bot. Trey also has advice for people wanting to start a career in data science.
Podcast Audio Links:
Link to podcast Episode 10 audio
Podcast’s RSS feed for podcast subscription apps
Podcast on Stitcher
Podcast on iTunes
Podcast Video Playlist:
Youtube playlist of interview videos
More about the Data Science Learning Club:
Data Science Learning Club Welcome Message
[learning club activity coming soon]
Data Science Learning Club Meet & Greet
Links to topics mentioned by Trey in the interview:
Commodore VIC-20
Bulletin Board
C++
Pascal
BASIC
Virginia Tech
Odyssey of the Mind
University of Washington Sociology
Complexity Theory and organizations
[more links to come! …sorry for all of the delays on getting this episode out! -Renee]
]]>Justin Kiggins, who calls himself a "full stack neuroscientist" talks to Renee about how he started as a musician majoring in music therapy, switched to mechanical engineering, and eventually made his way via biomedical engineering and neuroscience to study auditory perception and the brains of communicating birds. Podcast Audio Links: Link to podcast Episode 9 audio Podcast's RSS feed for podcast subscription apps Podcast on Stitcher Podcast on iTunes Podcast Video Playlist:]]>
Justin Kiggins, who calls himself a “full stack neuroscientist” talks to Renee about how he started as a musician majoring in music therapy, switched to mechanical engineering, and eventually made his way via biomedical engineering and neuroscience to study auditory perception and the brains of communicating birds.
Podcast Audio Links:
Link to podcast Episode 9 audio
Podcast’s RSS feed for podcast subscription apps
Podcast on Stitcher
Podcast on iTunes
Podcast Video Playlist:
Youtube playlist of interview videos
More about the Data Science Learning Club:
Data Science Learning Club Welcome Message
Learning Club Activity 9: Normalization [coming soon]
Data Science Learning Club Meet & Greet
Links to topics mentioned by Justin in the interview:
European Starling
.jpg)
video of starling singing
European Starling song file from Justin [1 min wav]
bird song recursive syntactic structure
Jobs for New Data Scientists website mentioned by Renee after interview
]]>Renee interviews computational biologist, author, data scientist, and Michigan State PhD candidate Sebastian Raschka about how he became a data scientist, his current research, and about his book Python Machine Learning. In the audio interview, Sebastian also joins us to discuss k-fold cross-validation for our model evaluation Data Science Learning Club activity.
Podcast Audio Links:
Link to podcast Episode 8 audio
Podcast’s RSS feed for podcast subscription apps
Podcast on Stitcher
Podcast on iTunes
Podcast Video Playlist:
Youtube playlist of interview videos
More about the Data Science Learning Club:
Data Science Learning Club Welcome Message
Learning Club Activity 8: Evaluation Metrics [coming soon]
Data Science Learning Club Meet & Greet
Links to topics mentioned by Sebastian in the interview:

Sebastian’s Python Machine Learning repository on GitHub
Python Machine Learning Book on DataSciGuide
scikit-learn – Voting Classifier
logistic regression (from Sebastian’s github)
regularization in logistic regression (from Sebastian’s github)
@rasbt on Twitter
Sebastian Raschka on Quora
Sebastian’s book on Amazon:

Data Scientist, Author, and manager of data science teams Enda Ridge talks to us about data governance, data provenance, reproducible analysis, work pipelines and products, and people, among other topics covered in his book “Guerrilla Analytics – A practical Approach to Working with Data: The Savvy Manager’s Guide”.
Podcast Audio Links:
Link to podcast Episode 7 audio
Podcast’s RSS feed for podcast subscription apps
Podcast on Stitcher
Podcast on iTunes
Podcast Video Playlist:
Youtube playlist of interview videos
More about the Data Science Learning Club:
Data Science Learning Club Welcome Message
Learning Club Activity 7: Linear Regression [coming soon]
Data Science Learning Club Meet & Greet
More show Notes Coming Soon!
Enda’s book on Amazon:

In this episode, Renee interviews Bioinformatics PhD and Data Scientist Erin Shellman about her path to becoming a data scientist, including jobs at Nordstrom Innovation Lab and zymergen. Erin discusses school, job interviews, teaching, and eventually getting to do data science within her field of scientific expertise.
Podcast Audio Links:
Link to podcast Episode 6 audio
Podcast’s RSS feed for podcast subscription apps
Podcast on Stitcher
Podcast on iTunes
Podcast Video Playlist:
Youtube playlist of interview videos
More about the Data Science Learning Club:
Data Science Learning Club Welcome Message
Learning Club Activity 6: k-Means Clustering [coming soon]
Data Science Learning Club Meet & Greet
Bioinformatics
Evolutionary Biology
Economics Game Theory
Machine Learning
Biostatistics
Information Science
Systems Biology
Systems Modeling
Comparative Genomics
Nordstrom Innovation Lab (old innovation lab links inactive – appears to be the Nordstrom Technology People Lab now)
Jim Vallandingham (d3)
Crushed It! Landing a Data Science Job
University of Michigan Computational Medicine and Bioinformatics
R
dplyr
ggvis
ggvis interactive controls
ggplot2
R Markdown
Hadley Wickham
Elements of Statistical Learning book
BI Tech CP303 (course Erin taught at University of Washington – use arrow keys to go through slides)
GitHub repository for class
regression
classification – logistic regression, trees
market basket analysis
clustering
UW Business Intelligence Certification
The first activity involved setting up a development environment. Some people are using R, some using python, and there are several different development tools represented. In this thread, several people posted what setup they were using. I posted a “hello world” program and the code to output the package versions.
Activities 1-3 built upon one another to explore a dataset and generate descriptive statistics and visuals, culminating with a business Q&A:
- Activity 1 – Find & Explore a Dataset
- Activity 2 – Visuals for Exploratory Data Analysis
- Activity 3 – Business Questions & Data Answers
I analyzed a subset of data from the eBird bird observation dataset from Cornell Ornithology for these activities. Some highlights included:
– Learning how to use the pandas python package to explore a dataset (code)
– Learning how to create cool exploratory visuals in Seaborn and Tableau. Here is an example scatterplot matrix made in Seaborn:
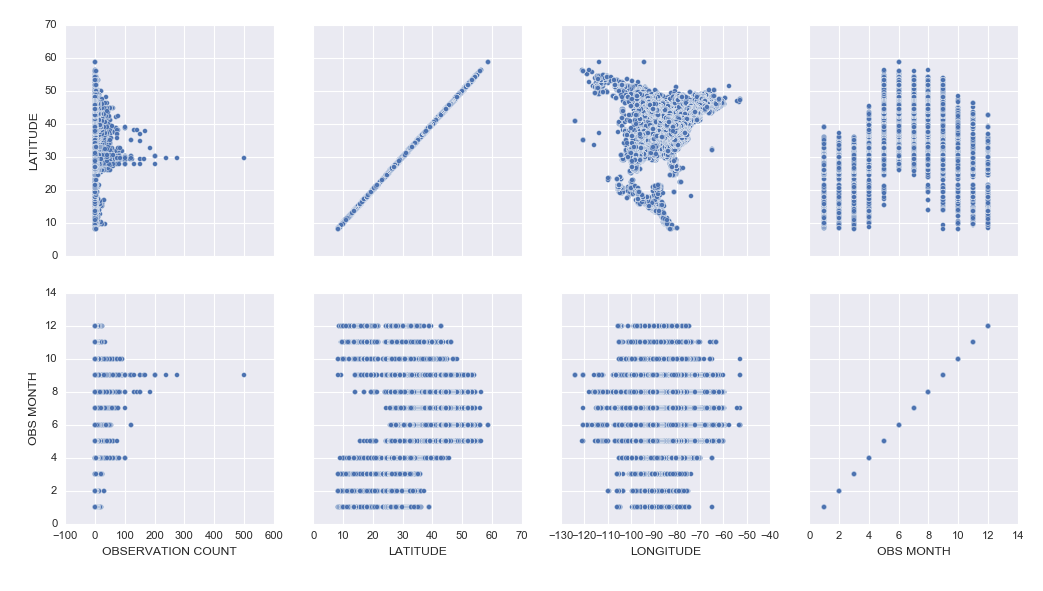
– I was most excited to learn how to build interactive Jupyter Notebook inputs, which I used to control Bokeh data visualizations to display Ruby-Throated Hummingbird migration into North America (notebook). Unfortunately, until I host them on a server where you can run the “live” version, you won’t be able to see the interactive widgets (a slider and dynamic dropdowns), but you can see a video of the slider working here:
Here’s my final output for Activity 3, a Jupyter Notebook (with code hidden, and unfortunately interactive widgets disabled) with the Q&A about the hummingbird migration:
Ruby-Throated Hummingbird Migration into North America
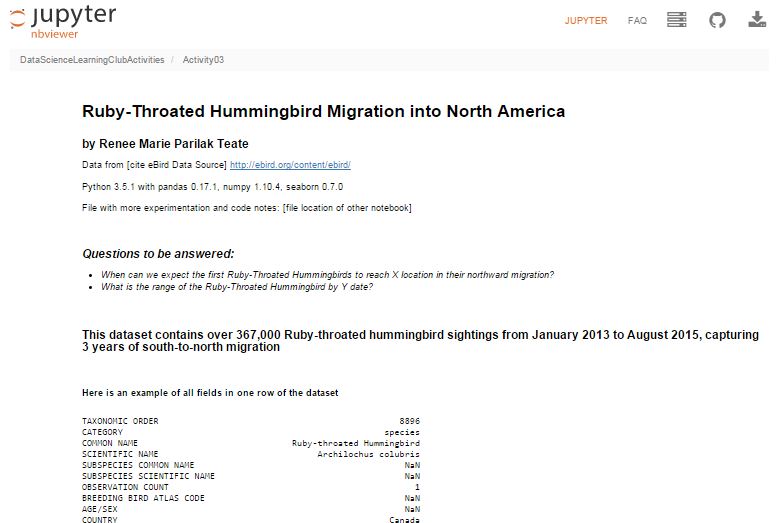
Activity 4 was built as a catch-up week for those of us who were behind, but had some ideas of math concepts to learn for those who had time.
We’re currently working on Activity 5, our first machine learning activity where we’re implementing Naive Bayes Classification.
All of my work is available in this github repository: https://github.com/paix120/DataScienceLearningClubActivities
I strongly encourage you to click through the forums and look at some of the other data explorations the members have been doing, including analysis of NFL data, personal music listening habits, transportation in London, German Soccer League data, top-grossing movies, and more!
It’s never too late to join the Data Science Learning Club! If you aren’t sure where to start, check out the welcome message for some clarification.
I’ll post again when I complete some of the machine learning activities!
]]>Renee Teate interviews Clare Corthell, founding partner of summer.ai (now Luminant Data) and creator of the Open Source Data Science Masters curriculum, about becoming a data scientist.
Podcast Audio Links:
Link to podcast Episode 5 audio
Podcast’s RSS feed for podcast subscription apps
Podcast on Stitcher
Podcast on iTunes
Podcast Video Playlist:
Youtube playlist of interview videos
More about the Data Science Learning Club:
Data Science Learning Club Welcome Message
Learning Club Activity 5: Naive Bayes Classification
Data Science Learning Club Meet & Greet
Resources/topics mentioned by Clare in the interview:
Management Science and Engineering
Markov Chains
Science, Technology, and Society at Stanford
A Challenge to Data Scientists (blog post Renee mentioned)
Mattermark
Product Management
Machine Learning
Open Source Data Science Masters
Nate Silver’s book The Signal and the Noise
Linear Algebra (on Khan Academy)
Bill Howe’s Introduction to Data Science Coursera Course
Recurrent Neural Nets
Bayesian Networks
Open Source Data Science Masters on GitHub (pull requests welcome!)
summer.ai (Update 2/15 – Clare’s company is now Luminant Data, Inc.)
@ClareCorthell on twitter
Other links:
SlideShare Slides about Open Source Data Science Masters
Talk Clare gave at Wrangle Conference about AI Design for Humans
]]>In Episode 4 of the Becoming a Data Scientist Podcast, we meet Sherman Distin, owner of analytics consulting firm QueryBridge. We discuss his primarily self-taught path to learning the data science techniques he uses to find business insights in marketing data, and he also tells us what he thinks is the most important trait he looks for in data scientists.
Podcast Audio Links:
Link to podcast Episode 4 audio
Podcast’s RSS feed for podcast subscription apps
Podcast on Stitcher
Podcast on iTunes
Podcast Video Playlist:
Youtube playlist of interview videos
More about the Data Science Learning Club:
Data Science Learning Club Welcome Message
Learning Club Activity 4: Learn a New Math Concept [to be posted Tuesday]
Data Science Learning Club Meet & Greet
Resources/topics mentioned by Sherman in the interview:
QueryBridge (Sherman’s business)
Target Pregnant Customer story
Survival Analysis
Proportional Hazards Model
@ShermanDistin on Twitter
]]>In Episode 3 of the Becoming a Data Scientist Podcast, we meet Shlomo Argamon, who is the founding director of the Master of Data Science program at Illinois Institute of Technology. He talks to us about his path to data science, including research in robotic vision and natural language processing, we discuss the traits of a good data science student, and he gives some advice for those of us learning data science.
Podcast Audio Links:
Link to podcast Episode 3 audio
Podcast’s RSS feed for podcast subscription apps
Podcast on Stitcher
Update 1/19: You should be able to find it on iTunes now!
Podcast Video Playlist:
Youtube playlist of interview videos
More about the Data Science Learning Club:
Data Science Learning Club Welcome Message
Learning Club Activity 3: Business Questions and Communicating Data Answers [to be updated Monday]
Data Science Learning Club Meet & Greet
Here are the links to things Shlomo references in the video:
Illinois Institute of Technology – Professional Master of Data Science Degree
machine vision
robotic mapping
Google Scholar Search for Shlomo Argamon’s publications related to robotics
“Passive map learning and visual place recognition” Doctoral Dissertation [ps.gz from yale]
probability theory
probability distributions
statistical inference
bayesian statistics
Natural Language Processing (NLP)
Google Scholar Search for Shlomo Argamon’s publications related to language
“Automatically Categorizing Written Texts by Author Gender” [Moshe Koppel, Shlomo Argamon, and Anat Rachel Shimoni]
Weka
scikit-learn
Natural Language Toolkit (nltk)
Ethics in Data Science at IIT
Becoming a Data Scientist – A Challenge to Data Scientists (re: bias)
In Episode 2 of the Becoming a Data Scientist Podcast, we meet Safia Abdalla, who started programming and even exploring machine learning and natural language processing as a teenager, and is now a student at Northwestern University, a conference speaker and trainer, co-organizer of PyLadies Chicago, and a contributor to Project Jupyter.
Podcast Audio Links:
Link to podcast Episode 2 audio
Podcast’s RSS feed for podcast subscription apps
(I will distribute the feed out to iTunes and Pocket Cast ASAP. It’s available on Stitcher now!)
Podcast Video Playlist:
Youtube playlist where I’ll publish future videos
More about the Data Science Learning Club:
Data Science Learning Club Welcome Message
Learning Club Activity 2: Creating visuals for exploratory data analysis
Data Science Learning Club Meet & Greet
Here are the links to things Safia references in the video:
information retrieval
Introduction to Information Retrieval by C. D. Manning, P. Raghavan, H. Schütze
natural language processing
NLTK
machine learning
Northwestern Neuroscience and Robotics Lab
pyladies
Chicago PyLadies Meetups
mathematicalmonk’s YouTube series on machine learning
@captainsafia on twitter
Safia’s website
Safia’s blog
JupyterDay Chicago 2016 (post by Safia on jupyter.org)
Jupyter documentation
If you have another podcast app, you can subscribe by entering the RSS feed link: https://www.becomingadatascientist.com/feed/podcast
There is also a built-in audio player here on the blog that I link to in each episode: https://www.becomingadatascientist.com/podcast/
I’m working on getting a logo now, so hopefully it won’t have a placeholder image for long :) I want to submit it to iTunes, but I have to download the dreaded iTunes desktop software in order to submit and manage it… ugh ridiculous.
Anyway, enjoy it on the blog and on Stitcher for now!
]]>In this episode we meet Will Kurt, who talks about his path from English & Literature and Library & Information Science degrees to becoming the Lead Data Scientist at KISSmetrics. He also tells us about his probability blog, Count Bayesie, and I introduce Data Science Learning Club Activity 1. Will has some great advice for people learning data science!
Podcast Audio Links:
Link to podcast Episode 1 audio
Podcast’s RSS feed for podcast subscription apps
(I will distribute the feed out to sites like iTunes and Stitcher this week)
Podcast Video Playlist:
Youtube playlist where I’ll publish future videos
More about the Data Science Learning Club:
Data Science Learning Club Welcome Message
Learning Club Activity 1: Find and explore a dataset
Data Science Learning Club Meet & Greet
Here are the links to things Will references in the video:
Library and Information Science
Andrew Ng’s Machine Learning course on Coursera
probabalistic graphical models
Count Bayesie blog
Count Bayesie – Parameter Estimation and Hypothesis Testing
Donald Knuth
Literate programming
Claude Shannon’s Mathematical Theory of Communication
Count Bayesie – Measure Theory
Bayes’ Theorem with Lego
Voight-Kampff and Bayes Factor
Black Friday Puzzle – Markov Chains
Zen Buddhism concept of “beginner’s mind”
Count Bayesie Recommended Books on Probability and Statistics
]]>(sorry for the poor video quality!)
In this episode, I talk a little about the podcast, I talk about my own background, and I introduce the Data Science Learning Club. Enjoy!
(Note: Episode 1, the first interview episode, comes out Monday 12/21!)
Podcast Audio Links:
Link to podcast Episode 0 audio
Podcast’s RSS feed for podcast subscription apps
(I will distribute this out to sites like iTunes and Stitcher soon)
Podcast Video Playlist:
Youtube playlist where I’ll publish future videos
More about the Data Science Learning Club:
Blog post about Data Science Learning Club
Learning Club Activity 0: Set up your development environment
Data Science Learning Club Meet & Greet
Here are the links with more info of things I reference in the video:
turtle logo programming language
carmen sandiego
lemmings
SimCity
JMU Integrated Science and Technology (ISAT)
Visual Basic/VB.NET/ASP.NET
MS Access
PL/SQL
Oracle Data Warehouse
IBM Cognos
CGEP UVA Systems Engineering
Systems Engineering
Linear Algebra at Khan Academy
Stochastic Simulation
Optimization
Cognitive Systems Engineering
Principles of Data Visualization for Exploratory Data Analysis
Machine Learning
Naive Bayes
K-Means
Pattern Recognition and Machine Learning (class textbook)
Summer of Data Science
API and Market Basket Analysis
Jupyter
Docker and Jupyter
Doing Data Science by Cathy O’Neill and Rachel Schutt
O’Reilly Data Science Books
(I’ll post more specific books later)
At the end of each podcast episode, I’ll be “assigning” a “Learning Activity” for the Data Science Learning Club. So that is starting tomorrow, too! There won’t be anyone teaching the content, but we’ll be exploring it together for 1-2 weeks between podcast episodes (usually 2 weeks). I’ll post some resources to get everyone started and help out data science beginners, then we’ll each explore the activity on our own with whatever tools and techniques we choose, and we can post our results so we can all learn from one another. If anyone gets stuck, you can post a question to the forum and hopefully someone will be able to help you through it.
I just got the Data Science Learning Club forum set up today, and it’s at this URL: https://www.becomingadatascientist.com/learningclub
Go check it out, register so you can participate, read the Welcome thread, and introduce yourself in the Meet & Greet section! Then tomorrow, the first learning activity will launch and you can get started.
I’m so excited about launching this podcast and data science learning club, and hope this turns out to be a valuable experience for all of us! Keep an eye out on the blog for the podcast post, which should go up tomorrow!
Renee
]]>